


Abstract
The origin of tetraploid wheat and the divergence of diploid ancestors of wheat A and D genomes were estimated to have occurred 0.36 and 2.7 million years ago, respectively. These estimates and the evolutionary history of 3159 gene loci were used to estimate the rates with which gene loci have been deleted and duplicated during the evolution of wheat diploid ancestors and during the evolution of polyploid wheat. During diploid evolution, the deletion rate was 2.1 × 10⁻³ locus−1 MY−1 for single-copy loci and 1.0 × 10⁻² locus−1 MY−1 for loci in paralogous sets. Loci were duplicated with a rate of 2.9 × 10⁻³ locus−1 MY−1 during diploid evolution. During polyploid evolution, locus deletion and locus duplication rates were 1.8 × 10⁻² and 1.8 × 10⁻³ locus−1 MY−1, respectively. Locus deletion and duplication rates correlated positively with the distance of the locus from the centromere and the recombination rate during diploid evolution. The functions of deleted and duplicated loci were inferred to gain insight into the surprisingly high rate of deletions of loci present apparently only once in a genome. The significance of these findings for genome evolution at the diploid and polyploid level is discussed.
HOMEOLOGOUS chromosome segments or entire homeologous chromosomes can be readily identified by comparative linkage mapping across the grass family. This remarkable observation led to the conclusion that the evolution of grass genomes proceeded by shuffling a limited number of syntenic blocks, leaving gene content within them conserved (Moore et al. 1995). However, DNA sequence comparisons in several regions across the grass family suggested that this “Lego-like” model of grass genome evolution needs a reassessment (Bennetzen 2000; Bennetzen and Ramakrishna 2002; Gaut 2002). Comparative sequencing revealed that synteny within syntenic blocks is occasionally perturbed by small rearrangements of genes, most often by tandem gene duplications and their reversions (Bennetzen 2000; Bennetzen and Ramakrishna 2002). The construction of deletion maps of hexaploid wheat (Triticum aestivum, genomes AABBDD) employing Southern blot hybridization of thousands of expressed sequence tag (EST) unigenes (Lazo et al. 2004; Qi et al. 2004) with a set of wheat deletion stocks (Qi et al. 2003) facilitated a large-scale synteny comparison across the grass family (Sorrells et al. 2003). Numerous synteny perturbations were encountered, although the incompleteness of wheat deletion maps and the rice genomic sequence at that time and the possibility of undetected structural rearrangements differentiating wheat and rice chromosomes allowed neither quantification of these perturbations nor determination of their causes.
In contrast to wheat-rice comparisons, the genomes of tetraploid wheat (Triticum turgidum) and hexaploid wheat (T. aestivum) offer a well-defined experimental system for synteny quantification and estimation of rates with which gene loci have been deleted and duplicated along chromosomes. Wheat species form a polyploid series at three ploidy levels. Wild tetraploid wheat, Triticum turgidum ssp. dicoccoides (genome formula AABB), originated via hybridization of wild diploid einkorn wheat, Triticum urartu (genome formula AA), with a close relative of the goat grass Aegilops speltoides (genome formula SS, where S is closely related to B) (Sarkar and Stebbins 1956; Dvorak and Zhang 1990; Dvorak et al. 1993). The hexaploid T. aestivum (genome formula AABBDD) originated via hybridization of tetraploid T. turgidum with diploid Aegilops tauschii (Kihara 1944; McFadden and Sears 1946). The archeological record suggests that T. aestivum originated ∼8000 years ago (Nesbitt and Samuel 1996) but the time of the origin of T. turgidum ssp. dicoccoides is uncertain (Huang et al. 2002).
Most chromosomes of the three wheat genomes are collinear (Gale et al. 1993). A notable exception is chromosome 4A, which was rearranged by several inversions and translocations (Devos et al. 1995; Mickelson-Young et al. 1995). A short paracentric inversion probably differentiates distal regions of chromosomes 4B and 4D (M. C. Luo and J. Dvorak, unpublished results), and chromosome arms 5AL, 2BS, 6BS, and 7BS were involved in translocations of short terminal segments (Naranjo et al. 1987; Devos et al. 1993).
Akhunov et al. (2003a) exploited the collinearity of wheat homeologous chromosomes for an assessment of their synteny. Mapped ESTs were extracted from the wheat EST database (http://wheat.pw.usda.gov/NSF/) and ambiguities were resolved by additional mapping. The analysis of the resulting database revealed that synteny between wheat homeologous chromosomes declined in the centromere-to-telomere direction (Akhunov et al. 2003a) and the decline correlated positively with the distance from the centromere (negatively with the distance from the telomere) and positively with the recombination rate along the average wheat chromosome arm.
Recombination rate along the average wheat chromosome arm increases in the distal direction and the increase follows a second-order polynomial or exponential function (Lukaszewski and Curtis 1993; Akhunov et al. 2003b). It is slow and approximately linear in the proximal two-thirds and rises steeply in the distal one-third. This change in recombination rate divides the average chromosome arm into a proximal, low-recombination interval (LR), accounting for the proximal two-thirds of the arm, and a distal, high-recombination interval (HR) accounting for its distal one-third (Akhunov et al. 2003a,b). The negative correlation of synteny and recombination rate along wheat chromosomes is consistent with the observation that insertions of paralogous genes along polyploid wheat chromosomes are correlated with recombination rate (Akhunov et al. 2003b) and that polymorphisms for interstitial deletions of gene loci are most frequent in distal, high-recombination regions of polyploid wheat chromosomes (Dvorak et al. 2004).
One of the consequences of population-size bottlenecks that usually accompany speciation is an increase in genetic drift and a loss of neutral genetic variation. Consequently, only a portion of polymorphisms for gene deletions and duplications present in a species is transmitted to the emerging species and contributes to genome evolution along the lineage—principally, those deletions and duplications that are in a high frequency. The fate of polymorphism for deletions present in T. turgidum during the speciation of hexaploid T. aestivum illustrates clearly this point (Dvorak et al. 2004). Deletions that were fixed or in a high frequency in T. turgidum passed through the bottleneck that accompanied the speciation of hexaploid T. aestivum. All those that were in low frequencies in T. turgidum were not detected in T. aestivum. The tendency of polymorphic locus deletions and duplications to be lost must be taken into account if the goal is to estimate the rates of locus deletions and duplications during evolution.
The objective of this study was to estimate rates of gene locus deletions and duplications during diploid and polyploid evolution in the Triticum-Aegilops alliance and to quantify relationship between these rates and the recombination rate. A strategy described by Akhunov et al. (2003a) was employed to estimate these rates using the time since the divergence of the wheat A and D genomes to their convergence in polyploid wheat and since the origin of polyploid wheat to the present. The divergence of the A and D genomes was reported to have occurred between 2.5 and 4.5 million years ago (MYA), and tetraploid wheat was concluded to have originated <0.5 MYA (Huang et al. 2002). Another estimate of the age of tetraploid wheat was reported by Mori at al. (1995), who computed it from RFLP, assuming that RFLP in wheat is caused by nucleotide substitutions in restriction sites. Because a large portion of wheat RFLP is caused by repeated sequence insertions and deletions, which originate faster than nucleotide substitutions, the resulting estimate, 0.23–1.35 million years (MY), overestimated by an unknown amount the age of tetraploid wheat.
The estimates reported by Huang et al. (2002) were based on nucleotide sequences of two nuclear loci, using several accessions per species. The divergence of species and the divergence of haplotypes seldom coincide (Nei 1987). Because haplotype divergence often precedes the divergence of recently diverged species, estimates of species divergence time can be inflated if care is not taken to minimize this disparity (Nei 1987). Nei (1987) pointed out that this problem is not particularly significant for time estimates >1 MY. It is uncertain to what extent this is also true for self-pollinating species, in which recombination between different haplotypes is infrequent. Because confidence in divergence time estimates was critical for this study, we were compelled to reinvestigate the divergence time of the A and D genomes. We sequenced four genes and made an exhaustive haplotype survey for each of them.
MATERIALS AND METHODS
Evolutionary history of 3159 loci:
The wheat EST database (http://wheat.pw.usda.gov/cgi-bin/westsql/map_locus.cgi) contains mapping data and images of autoradiograms of wheat ESTs hybridized with Southern blots of DNAs of T. aestivum Chinese Spring deletion stocks containing 159 overlapping deletions covering the entire length of the 21 wheat chromosomes along with DNAs of Chinese Spring ditelosomics and nulli-tetrasomics. We extracted from this database data for EST unigenes for which either all restriction fragments present in the hybridization profile were mapped or a maximum of a single fragment was left unmapped. For each locus detected by Southern hybridization in this database, we determined if orthologous loci were in the Chinese Spring A, B, and D genomes. If an ortholog(s) appeared to be absent in one or two of the three genomes, the absence was validated and synteny perturbation was characterized as described earlier (Akhunov et al. 2003a). Briefly, an EST unigene was hybridized with a set of Chinese Spring disomic substitution lines in which each Chinese Spring chromosome was individually replaced by its Lophopyrum elongatum homeologue (Dvorak 1980; Dvorak and Chen 1984; Tuleen and Hart 1988) and a set of barley disomic addition lines (Islam et al. 1981). Each such EST unigene was also hybridized with a panel of genetically diverse lines of T. urartu, Ae. tauschii, and Ae. speltoides. Designations and origins of these lines are described in Akhunov et al. (2003a). These data were used to validate each tentative perturbation of synteny found in the wheat EST database to determine whether the perturbation was due to gene locus deletion or gene locus duplication and when the event originated relative to the divergence of barley, L. elongatum, and the three wheat genomes and the convergence of the A and B genomes in tetraploid wheat and the A, B, and D genomes in hexaploid wheat. For each paralogous set with perturbed synteny, it was determined which locus was the ancestral locus of the paralogous set (Akhunov et al. 2003a). Deletions and duplications that originated during a time interval from the divergence of T. urartu and Ae. tauschii to the origin of polyploid wheat were used for measuring rates at the diploid level. Deletions and duplications that originated since the origin of tetraploid wheat in the A genome and since the origin of hexaploid wheat in the D genome were used for measuring rates at the polyploid level (supplementary Table S1 at http://www.genetics.org/supplemental/). By this process we achieved an exhaustive analysis of orthology and recent evolutionary history for a total of 3159 loci in the A and D genomes. The B-genome deletions and duplications were not considered here because the cross-pollinating habit and resulting heterozygosity of Ae. speltoides, a diploid reference species for the wheat B genome, would have greatly complicated these inferences.
Phylogenetic analysis:
Four genes present in a single-copy per genome in wheat were selected for the estimation of divergence time between diploid progenitors of the A and D genomes of polyploid wheat. The sequences of EST contigs containing the mapped ESTs BE471272, BE636979, BG274853, and BE490164 were retrieved from the GrainGenes wEST database (http://wheat.pw.usda.gov/wEST). The putative function of each gene was determined by comparing EST sequences with the NCBI protein database (htpp://www.ncbi.nlm.nih.gov) using the BLASTX program. The gene locus detected by BE471272 expressed an unknown protein (UP) and the gene loci detected by BE636979, BG274853, and BE490164 expressed a seed maturation protein (SMP), an ATP-dependent metalloprotease (ADM) belonging to the AAA-protein family, and a hydroxylase (HX), respectively. EST sequences were also used for BLASTN search of the NCBI database. The sequences matching maize, rice, barley, wheat, rye, sugarcane, sorghum, Arabidopsis, and pepper were downloaded and aligned with the ClustalW program (http://www.ebi.ac.uk). Translated alignments of these sequences were used as references during the manual editing of DNA alignments with GeneDoc (http://iubio.bio.indiana.edu/soft/molbio/ibmpc/genedoc-readme.html). Highly diverged regions were excluded from alignments.
Sequence alignments of HX (975 bp), ADM (1762 bp), and SMP (637 bp) were used for the estimation of divergence time between wheat and barley. The maximum-likelihood (ML) method for the construction of phylogenetic trees was used. Since the estimation of branch lengths is influenced strongly by nucleotide substitution model assumptions, we first performed the hierarchical likelihood-ratio tests using the MODELTEST program (version 3.5) (Posada and Grandall 1998). MODELTEST performs the likelihood-ratio test for substitution model parameters and helps to choose the most appropriate model. Hierarchical likelihood-ratio tests were conducted for the first, second, and third codon positions, the first and second positions combined, and the complete sequences for each gene. After choosing a nucleotide substitution model, we constructed ML trees with both relaxed and enforced molecular clocks as implemented in PAUP (version 4.0b10) (Swofford 2001). The existence of a molecular clock was tested with a likelihood-ratio test (Table 1). The data sets for which the molecular clock was not rejected were selected for the estimation of divergence time between barley and wheat. The divergence times were estimated using the Langley-Fitch method (Langley and Fitch 1974) as implemented in the r8s program (http://ginger.ucdavis.edu/sandlab/SOFTWARE/software.htm).
Likelihood-ratio tests of molecular clock for a putative seed maturation protein, an ATP-dependent metalloprotease, and a hydroxylase
Gene | Substitution modela | 2ΔL | d.f. | P-value |
|---|---|---|---|---|
| SMP first and second position | K80 + G | 4.607 | 5 | 0.466 |
| SMP third position | HKY | 11.620 | 5 | 0.040 |
| SMP all three positions | HKY + G | 3.062 | 5 | 0.690 |
| ADM first and second position | TrN + G | 355.559 | 4 | <0.01 |
| ADM third position | HKY + G | 14.186 | 4 | 0.007 |
| ADM all positions | TrN + G | 27.097 | 4 | <0.01 |
| ADM first position | GTR + G | 6.894 | 4 | 0.486 |
| ADM second position | TrN + G | 29.600 | 4 | <0.01 |
| HX first position | HKY + G | 12.863 | 4 | 0.012 |
| HX second position | HKY + G | 5.397 | 4 | 0.249 |
| HX third position | HKY + G | 5.155 | 4 | 0.272 |
| HX first and second position | HKY + G | 7.721 | 4 | 0.102 |
| HX all positions | HKY + G | 7.809 | 4 | 0.099 |
SMP, seed maturation protein; ADM, ATP-dependent metalloprotease; HX, hydroxylase.
K80 is the Kimura-2-parameter model (Kimura 1980), HKY is the Hasegawa, Kishino, Yano model (Hasegawa et al. 1985), TrN is the Tamura-Nei model (Tamura and Nei 1993), GTR is the general time reversible model (Rodriguez et al. 1990), and +G stands for rate variation among sites.
The divergence time of wheat and barley lineages averaged across the three genes was used for the calculation of divergence time of the diploid progenitors of the wheat A and D genomes, using all four genes. To measure divergence without confounding effects of polymorphism is critical in divergence timing of closely related species. Regions of SMP (1004 bp), HX (325 bp), ADM (1562 bp), and UP (687 bp) including intronic sequences were therefore sequenced in multiple accessions of Ae. tauschii (226 accessions) and T. urartu (315 accessions). These genes were also sequenced in 96 accessions of barley. Sequence divergence between species was corrected for sequence divergence of haplotypes by calculating the net nucleotide divergence as implemented in MEGA (version 2.1; http://www.megasoftware.net). Only synonymous and noncoding sequences were analyzed. The nucleotide substitution rates were calculated according to Gaut et al. (1996).
Rates:
For the A genome at the diploid level, we used a time interval from the origin of the A genome 2.7 MYA to its convergence with the B genome in tetraploid wheat 0.36 MYA. For the D genome at the diploid level, a time interval from its origin 2.7 MYA to its convergence with the A and B genomes in hexaploid wheat ∼8000 years ago was used. For the computation of correlations and regressions, the average wheat chromosome arm was divided into six intervals, 0.17 of the arm length long, and locus deletion and locus duplication events were allocated into these intervals. To have a sufficient sample size and to minimize sampling variation, the A- or D-genome data were combined, and 2.54 MY, the average time that the A and D genome spent at the diploid level, was used in the rate computations. The rate was computed per locus, using the total number of loci per interval.
Functional classification of loci:
ESTs were downloaded from the wEST-SQL database (http://wheat.pw.usda.gov/west). Their function was determined by BLASTX search against protein databases using an E-value threshold of 10−5. Additionally, EST contigs were classified into functional groups using InterProScan and GO software (Zdobnov and Apweiler 2001).
RESULTS
The A- and D-genome divergence time:
First, we estimated the time of wheat-barley divergence from the exonic sequences. Molecular clock was calibrated using the divergence time of the rice and maize lineages set at 55 MYA (Kellogg 2001). The likelihood-ratio test of nucleotide substitution models indicated that the evolution of complete sequences of the SMP and HX genes and the first positions of ADM gene codons were consistent with the molecular clock (Table 1). These sequences were therefore selected for the estimation of wheat and barley divergence time. The hypothesis of the molecular clock was rejected for the second and third positions of each gene, the first and second positions combined of each gene, and the complete sequence of the ADM gene (Table 1), and these sequences were not used for this purpose. Wheat-barley divergence times computed from SMP, HX, and ADM nucleotide sequences were 11.3, 8.3, and 10.8 MYA, respectively; the mean was 10.1 MYA.
Because nucleotide divergence in the coding regions of the four T. urartu and Ae. tauschii genes was insufficient to estimate the divergence time, intronic sequences were used for timing of T. urartu and Ae. tauschii divergence. The mean divergence time set at 10.1 MYA was used to calibrate the intronic clock of wheat-barley divergence. The nucleotide substitution rate between the wheat and barley lineages in intronic sequences was computed for each gene (Table 2). The estimated intronic nucleotide substitution rate ranged from 4 × 10⁻⁹ to 8 × 10⁻⁹ nucleotide−1 year−1 among the four genes (Table 2). Using these rates and the net nuclotide distance of intronic sequences, Ae. tauschii and T. urartu were estimated to have diverged 2.7 MYA (Figure 1) with a 95% confidence interval of 1.4–4.1 MYA.
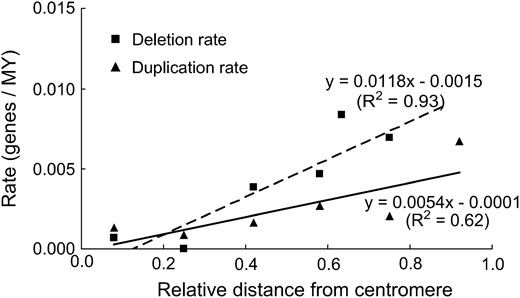
Linear regressions of locus deletion rate and locus duplication rate in six intervals along the average wheat chromosome arm, each 0.17 of the average chromosome arm long, against relative physical distance of the interval from the centromere. The centromere is at 0.0 on the horizontal axis and the telomere is at 1.0. An equation fitting each set of data and its R2 is shown.
Divergence time of T. urartu and Ae. tauschii in million years estimated from intronic nucleotide sequence divergence and the time of origin of wild tetraploid wheat T. turgidum ssp. dicoccoides in MY estimated from the number of locus duplications
Gene | Total wheat-barley nucleotide divergence | Mean nucleotide substitution rate per MY | T. urartu and Ae. tauschii divergence time | Origin of T. dicoccoides |
|---|---|---|---|---|
| UP | 0.04 | 0.004 | 4.0 | 0.54 |
| HX | 0.04 | 0.004 | 1.2 | 0.16 |
| SMP | 0.06 | 0.006 | 3.7 | 0.49 |
| ADM | 0.09 | 0.008 | 2.0 | 0.27 |
| Mean | 2.7 | 0.36 | ||
| 95% confidence interval | 1.4–4.1 | 0.19–0.54 |
Time of the origin of tetraploid wheat:
Because it is difficult to estimate short divergence times from nucleotide sequences, locus duplications were used as a clock in the estimation of the age of Triticum dicoccoides. Only 2 of 15 duplications that have occurred in the A genome of Chinese Spring since its divergence from the Ae. tauschii lineage 2.7 MYA originated at the polyploid level, indicating that T. dicoccoides originated 0.36 MYA with a 95% confidence interval ranging from 0.19 to 0.54 MYA (Table 2).
Locus deletion and duplication rates:
DNA hybridization data of 1993 EST unigenes with Southern blots of wheat deletion stocks were used to detect loci with perturbed synteny in T. aestivum cv Chinese Spring. All detected synteny perturbations were verified by EST hybridization with Southern blots of Chinese Spring-L. elongatum disomic substitution lines as described previously (Akhunov et al. 2003a). The verified synteny perturbations were characterized further: whether the perturbation was due to gene locus deletion or gene locus duplication and when the event originated. For events that involved paralogous sets of loci, it was determined which locus of the set was the ancestral locus and which locus or loci originated by duplication of the ancestral locus. Deletions and duplications that originated since the divergence of T. urartu and Ae. tauschii to the origin of tetraploid wheat for the A genome and hexaploid wheat for the D genome were used for measuring locus deletion and duplication rates at the diploid level. A-genome deletions and duplications that originated since the origin of tetraploid wheat and D-genome deletions and duplications that originated since the origin of hexaploid wheat were used for measuring rates at the polyploid level.
Of a total of 3159 Chinese Spring A- and D-genome loci, 61 lacked an ortholog in the other genome due to locus deletion or duplication that originated since the A- and D-genome divergence; an ortholog absence was caused by a deletion at 36 loci and duplication at 25 loci (Table 3). Twenty-six deletions originated at the diploid level and 10 originated at the polyploid level. Twenty-three locus duplications originated at the diploid level and 2 originated at the polyploid level.
Deletion rates of single-copy loci and loci in paralogous sets (paralog) and locus duplication rates in distal, high-recombination and proximal, low-recombination intervals and along the entire average wheat chromosome arm at the diploid and polyploid levels
Type of event | Level | Recombination | Mean divergence time in MY | 95% C.I. of divergence time (MY) | No. loci | No. events | Rate (per locus per MY) | Range |
|---|---|---|---|---|---|---|---|---|
| Deletion of single copy | Diploid | Low | 2.54 | 1.29–3.79 | 1491 | 4 | 1.1 × 10⁻³ | 7.1 × 10⁻⁴–2.1 × 10⁻³ |
| High | 1194 | 10 | 3.3 × 10⁻³ | 2.2 × 10⁻³–6.5 × 10⁻³ | ||||
| Entire arm | 2685 | 14 | 2.1 × 10⁻³ | 1.4 × 10⁻³–4.1 × 10⁻³ | ||||
| Deletion of paralog | Diploid | Low | 2.54 | 1.29–3.79 | 190 | 2 | 4.1 × 10⁻³ | 2.8 × 10⁻³–8.2 × 10⁻³ |
| High | 284 | 10 | 1.4 × 10⁻² | 9.3 × 10⁻³–2.7 × 10⁻² | ||||
| Entire arm | 474 | 12 | 1.0 × 10⁻² | 6.7 × 10⁻³–2.0 × 10⁻² | ||||
| Deletion of single copy | Polyploid | Low | 0.36 | 0.19–0.54 | 724 | 2 | 7.7 × 10⁻³ | 5.1 × 10⁻³–1.5 × 10⁻² |
| High | 582 | 5 | 2.4 × 10⁻² | 1.6 × 10⁻²–4.5 × 10⁻² | ||||
| Entire arm | 1306 | 7 | 1.5 × 10⁻² | 1.0 × 10⁻²–2.8 × 10⁻² | ||||
| Deletion of paralog | Polyploid | Low | 0.36 | 0.19–0.54 | 100 | 0 | ||
| High | 144 | 3 | 5.8 × 10⁻² | 3.9 × 10⁻²–1.1 × 10⁻¹ | ||||
| Entire arm | 244 | 3 | 3.4 × 10⁻² | 2.3 × 10⁻²–6.5 × 10⁻² | ||||
| Duplication | Diploid | Low | 2.54 | 1.29–3.79 | 1681 | 7 | 1.6 × 10⁻³ | 1.1 × 10⁻³–3.2 × 10⁻³ |
| High | 1478 | 16 | 4.3 × 10⁻³ | 2.9 × 10⁻³–8.4 × 10⁻³ | ||||
| Entire arm | 3159 | 23 | 2.9 × 10⁻³ | 2.0 × 10⁻³–5.6 × 10⁻³ | ||||
| Duplication | Polyploid | Low | 0.36 | 0.19–0.54 | 1681 | 0 | ||
| High | 1478 | 2 | 3.8 × 10⁻³ | 2.5 × 10⁻³–7.1 × 10⁻³ | ||||
| Entire arm | 3159 | 2 | 1.8 × 10⁻³ | 1.2 × 10⁻³–3.3 × 10⁻³ |
A total of 93% deletions and duplications that originated at the diploid level were fixed in the broad sample of germplasm of the respective diploid species. Because the survey of locus deletions and duplications was performed in a single line of T. aestivum (Chinese Spring), the extreme population size reduction during sampling minimized the likelihood that locus deletions and duplications that were polymorphic in T. aestivum, particularly those in low frequencies, were included in the sample. Sampling of fixed and high-frequency events at both ploidy levels minimized the inflating effects of polymorphism on the estimation of rates of gene locus deletion and duplication during evolution.
The A- and D-genome divergence time and convergence time in polyploid wheat were used to compute mean locus deletion and duplication rates (Table 3). At the diploid level, mean locus deletion rate was 2.1 × 10⁻³ and 1.0 × 10⁻² locus−1 MY−1 for single-copy loci and loci in paralogous sets, respectively. Disregarding locus class, mean locus deletion rate was 3.2 × 10⁻³ locus−1 MY−1. Mean locus duplication rate at the diploid level was 2.9 × 10⁻³ locus−1 MY−1, which was similar to the overall locus deletion rate.
Deletion and duplication rates could be computed for the A genome only at the polyploid level because no deletion or duplication that originated at the polyploid level was detected in the Chinese Spring D genome. Mean deletion rate at the polyploid level, disregarding locus class, was 1.8 × 10⁻² locus−1 MY−1 but mean locus duplication rate was one order of magnitude lower, 1.8 × 10⁻³ locus−1 MY−1.
Relationship to gene location along the arm and recombination rate:
The average wheat chromosome arm was divided into six equal intervals, and the frequencies of locus deletions and duplications at the diploid level were computed for each interval (supplementary Tables S2, S3, and S4 at http://www.genetics.org/supplemental/). Rates in each interval were computed using time estimates in Table 3. Because the rates within an interval were expressed per locus, they were independent of variation in relative gene density along the average chromosome arm.
Deletion rate correlated positively with distance from the centromere (negatively with distance from the telomere) (r = 0.96, P = 0.002) and with recombination rate (r = 0.94, P = 0.005) (Figures 1 and 2). The rates of locus duplication at the diploid level also correlated positively with distance from the centromere (negatively with distance from the telomere) (r = 0.79, P = 0.06) and with recombination rate (r = 0.90, P = 0.01) (Figures 1 and 2). The slopes of regression lines for locus deletions were greater than the slopes of lines for locus duplications (P = 0.04 and 0.06).
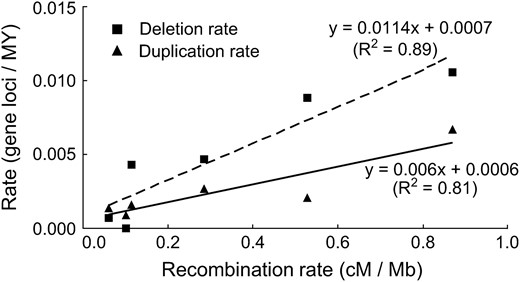
Linear regressions of locus deletion rate and locus duplication rate in six intervals along the average wheat chromosome arm, each 0.17 of the average wheat chromosome arm long, against recombination rate. An equation fitting each set of data and its R2 is shown.
For additional analyses, the average chromosome arm was divided into only two intervals: the LR and HR intervals containing approximately equal numbers of loci (Table 3). At the diploid level, deletion rates were higher in the HR interval than in the LR interval for both single-copy genes (P = 0.05, 2 × 2 contingency table and Fisher's exact test) and loci within paralogous sets (P = 0.13) (Table 3). The HR interval was also enriched for duplicated loci (P = 0.03). At the polyploid level, deletion rates for single-copy genes and loci in paralogous sets were higher in the HR interval than in the LR interval (Table 3), although the differences could not be statistically tested for inadequate numbers of events.
Functional classification of deleted and duplicated loci:
To determine the biological function of deleted and duplicated genes, databases were searched for homology with the ESTs located in the HR interval (Table 4). Because of low numbers of deleted and duplicated genes in the LR interval, the LR interval was not subjected to this analysis. Either most of the deleted or duplicated loci had a defined function or their function was unknown but genes with a homologous sequence were present across the grass family. No sequence corresponding to an EST was encountered in databases for 40 and 8% of the deleted and duplicated single-copy genes, respectively, at the diploid level.
Functional classification of all loci and deleted and duplicated loci in the high-recombination interval in the A- and D-genome chromosomes at the diploid level
Deleted loci | ||||
|---|---|---|---|---|
| Functional class | All loci | Single-copy | Paralogous sets | Duplicated loci |
| Cell growth/maintenance | 24 (7) | 2 (8) | ||
| Development | 4 (1) | |||
| Energy/electron transport | 17 (5) | 3 (19) | 2 (8) | |
| Membrane transport | 12 (4) | 1 (6) | ||
| Metabolism | 65 (20) | 1 (10) | 6 (38) | 10 (42) |
| Protein synthesis | 14 (4) | 3 (19) | 1 (4) | |
| Seed storage | 6 (2) | 3 (30) | ||
| Signal transduction | 28 (8) | 1 (6) | 1 (4) | |
| Biotic and biotic stress | 18 (5) | 1 (10) | 4 (17) | |
| Structural | 5 (2) | |||
| Transcript. and replication | 27 (8) | 1 (10) | 1 (4) | |
| Other | 1 (<1) | |||
| Unknown | 19 (6) | 2 (13) | 1 (4) | |
| No match | 94 (28) | 4 (40) | 2 (8) | |
Percentages are in parentheses.
DISCUSSION
Divergence time:
All estimates of wheat and barley divergence obtained to date vary in a narrow range. Ramakrishna et al. (2002) reported 11–15 MYA, Huang et al. (2002) reported 11 MYA, and we arrived at an estimate of 10.1 MYA. The divergence time of 10.1 MYA for the wheat and barley lineages was then used to calibrate the intronic clocks to estimate the divergence time of the A and D genomes. The divergence of the two genomes was estimated to have occurred 2.7 MYA with a 95% confidence interval from 1.4 to 4.1 MYA. The A- and D-genome divergence forms a basal branch in the Triticum-Aegilops alliance and therefore estimates the age of the entire alliance (Dvorak and Zhang 1992). Huang et al. (2002) timed the radiation of the Triticum-Aegilops alliance from 2.5 and 4.5 MYA. This estimate was based on the sequences of two genes and a few accessions per species. Although we used four genes, made an extensive survey of each species for haplotypes, and used net nucleotide distance estimates between species to estimate divergence time, our estimates were only slightly lower than those reported by Huang et al. (2002). We therefore conclude that the two studies arrived at similar estimates.
Huang et al. (2002) could not estimate the age of tetraploid wheat from nucleotide sequences but concluded that the paucity of nucleotide substitutions differentiating tetraploid wheat from its ancestors suggested that it originated <0.5 MYA. We used the accumulation of gene duplications as a clock and arrived at an estimate of 0.36 MYA.
Gene deletion and duplication rates:
The 3159 loci investigated here were previously used in the investigation of synteny between wheat homeologous chromosomes (Akhunov et al. 2003a). Synteny was shown to correlate negatively with distance from the centromere and recombination rate. Akhunov et al. (2003a) reported a strategy for the determination of causes of perturbed synteny and applied it to a limited number of loci with perturbed synteny. This characterization was completed here. These data and the estimates of the A- and D-genome divergence time and the age of T. turgidum ssp. dicoccoides were used to estimate gene locus deletion and gene locus duplication rates during diploid and polyploid evolution. To our knowledge, these estimates have not been reported for any other eukaryotic lineage.
At the diploid level, the mean locus deletion rate of single-copy loci (2.1 × 10⁻³ locus−1 MY−1) was one-fifth of the deletion rate of loci in paralogous sets (1.0 × 10⁻² locus−1 MY−1). The difference between these rates was almost certainly caused by relaxation of selection in paralogous sets against gene deletions. Locus deletion rate in paralogous sets was similar to locus deletion rate at the polyploid level, which was 1.8 × 10⁻² locus−1 MY−1, disregarding locus class. The similarity of these two rates suggests that polyploidy per se did not greatly enhance deletion rate beyond that caused by relaxation of selection.
Dvorak et al. (2004) estimated the rate of DNA loss from frequencies of deletion polymorphism in tetraploid and hexaploid wheat. The rate was seven times greater than the rate found here for the polyploid level. This glaring discrepancy is consistent with the hypothesis that polymorphism is a poor predictor of evolutionary rates because of its tendency to be lost due to genetic drift and possibly other factors. The sampling strategy used here captured predominantly fixed events, minimizing the inflating effects of polymorphism on evolutionary rate estimates. Dvorak et al. (2004) reported that 0.17% of the wheat D genome has been deleted since the origin of T. aestivum via rare polymorphic deletions. No deletion that originated in the Chinese Spring D genome since the origin of T. aestivum was recorded here, illustrating the conservative nature of the present estimates.
Locus duplication rate was estimated to be 2.9 × 10⁻³ and 1.8 × 10⁻³ locus−1 MY−1 at the diploid and polyploid level, respectively. Lynch and Conery (2000) reported that duplicated genes arise with a rate of 1 × 10⁻² gene−1 MY−1. That rate is three times as great as that reported here. The rate reported by Lynch and Conery (2000) includes all gene duplications, dispersed and tandem. Since only dispersed gene duplications (different loci) were studied here, the two values estimate different classes of genes and are not comparable.
The deletion rates at the polyploid level and within paralogous sets at the diploid level were almost an order of magnitude higher than locus duplication rates. This disparity suggests that if deletions were unconstrained by natural selection, gene loci would be deleted with a rate an order of magnitude greater than the duplication rate, and without natural selection, the gene content of grass genomes would contract. The fact that more than one-quarter of gene motifs (unigenes) are present as paralogous sets in the wheat genomes (Akhunov et al. 2003b) suggests that deletion is constrained by natural selection for a large portion of the duplicated loci and that the increase in the gene content size by gene duplication during the evolution of Triticeae genomes was selectively advantageous.
Relationship to recombination rate:
Locus deletion and duplication rates were shown here to correlate highly with recombination rate, which is increasing along the centromere-telomere axis of the average wheat chromosome arm. These relationships were not caused by the increase in gene density along the centromere-telomere axis of the average wheat chromosome arm (Akhunov et al. 2003b; Dvorak et al. 2003), because the rates were computed per locus in each interval.
The fact that deletions and insertions of duplicated loci occur more frequently in distal, high-recombination regions than in proximal, low-recombination regions of wheat chromosomes has been reported previously (Akhunov et al. 2003a,b; Dvorak et al. 2004). In those studies, however, it was not clear to what extent these relationships reflected polymorphism and to what extent they impacted evolution. In this study, we quantified the impact. During diploid evolution, both locus deletion and duplication rates were about three times as great in the distal, HR interval then in the proximal, LR interval. A similar disparity between the two intervals was also observed at the polyploid level.
There are at least two reasons why deletions can be expected to be more frequent in distal, high-recombination regions of chromosomes than in proximal, low-recombination regions. First, nonallelic homologous recombination between duplicated sequences on a chromosome causes, among other rearrangements, deletions of intervening DNA (Nathans et al. 1986; Vicient et al. 1999; Devos et al. 2002; Umezu et al. 2002; Lupski 2003; and others). Deletions are therefore expected to originate more often in high-recombination regions of chromosomes than in low-recombination regions (Dvorak et al. 2004). Second, polymorphism for neutral deletions is subjected to selection sweeps and background selection like any other neutral polymorphism (Maynard Smith and Haigh 1974; Charlesworth et al. 1993). Both processes result in greater loss of polymorphism in low-recombination regions than in high-recombination regions. Neutral gene deletions may have a greater chance to persist in populations in high-recombination regions than in populations in low-recombination regions and to be potentially transmitted during speciation into new species more readily in high-recombination regions than in low-recombination regions. This differential transmission is apparent in wheat deletion polymorphisms (Dvorak et al. 2004). Deletions in proximal, low-recombination regions of tetraploid wheat (T. turgidum) chromosomes were in low frequencies and none was transmitted from tetraploid wheat to hexaploid wheat (T. aestivum). In contrast, about half of those in distal, high-recombination regions were transmitted. The deletions that were fixed in T. turgidum were of course fixed also in T. aestivum.
The reason for the preferential location of duplicated loci in high-recombination regions of chromosomes is currently unknown. A possible reason for correlation between recombination rate and locus duplication rate is the effect of background selection and selection sweeps on polymorphisms, as pointed out above for gene deletions.
Functional classification and locus duplication-divergence-deletion cycle:
An unexpectedly high single-copy locus deletion rate at the diploid level (2.1 × 10⁻³ locus−1 MY−1) raises a legitimate concern about whether EST unigenes detecting such loci are actually cDNAs of genes or cDNAs of transposon sequences, which do appear with low frequencies in cereal cDNA libraries and EST databases (Echenique et al. 2002). Functional classification of the motifs of deleted genes makes this possibility unlikely. Known biological function could be assigned to 60% of the deleted single-copy EST unigenes. The remaining 40% of these ESTs had no match in any protein database. Genes with no match in the databases are quite frequent in the HR interval and constitute 28% of all genes there. Their incidence among the deleted genes is only slightly higher than expected on the basis of their frequency. EST unigenes with no match in the database showed no homology to either sequences in the Triticeae repeated sequence database or the redundant nucleotide sequence databases that include the majority of plant and animal transposons.
If most of the deleted single-copy loci are not transposons, what are they? To answer this question, we need to take into account the basis on which these genes were declared to be present only once per genome. DNA-DNA hybridization in Southern blots requires a high degree of nucleotide sequence homology (typically >80%) to generate a signal. A cDNA clone therefore will fail to detect diverged paralogues. Hence, some of the loci classified as single copy in this study may actually be genes in diverged paralogous sets. Since genes in such sets may have a similar function and could compensate for a deleted gene, such genes would be more dispensable than genes that are truly present only once in a genome. Fast-evolving gene motifs, such as those involved in disease resistance (Michelmore and Meyers 1998), are obvious candidates for paralogous gene sets subjected to duplication-divergence-deletion cycles. The unexpectedly high frequency of deletions of single-copy loci observed here indicates the importance of this cycle during plant evolution. Since duplicated loci and locus deletions preferentially occur in high-recombination regions, the duplication-divergence-deletion cycle preferentially involves genes in high-recombination chromosome regions.
Polyploid genome evolution:
Deletion rate at the polyploid level was estimated here to be 1.8 × 10⁻² locus−1 MY−1. Maize, which is a paleotetraploid with 20–40% of its gene content diploidized by deletions, depending on the stringency of criteria used (Gaut 2001), offers an opportunity to evaluate this constant. The relationship between diploidization and gene content reduction due to deletions is Dt = 2Gt (1 − Gt), where Dt is diploidization by deletions and Gt is gene content at time t (Dvorak et al. 2004). For 30% diploidization, Gt = 0.87. Solving the equation G0.87 = G0e−δt (a solution of the differential equation dG/dt = −δG, where δ is a deletion rate constant) for t suggests that the maize lineage was tetraploidized 8.2 MYA. The tetraploidization time of the maize lineage was estimated to be between 11 and 16 MYA (Gaut and Doebley 1997). Deletion rate is expected to be greater in the initial stages of tetraploid evolution (exemplified by wheat) than in the later stages because of the increase in the intensity of selection against gene deletions with time (Dvorak et al. 2004). Hence, a deletion constant derived from polyploid wheat is expected to underestimate the time of maize lineage tetraploidization. Considering that fact, the deletion rate constant for a polyploid estimated here seems to be consistent with the level of diploidization in maize. The deletion constants for the polyploid level predict that high-recombination regions of grass chromosomes are diploidized at least twice as fast as low-recombination regions.
Conclusions:
Gene loci were deleted and duplicated during the recent history of wheat genomes with surprisingly high rates. In light of these rates, imperfect microsynteny that has been reported in several genomic regions sequenced across the grass family (Bennetzen and Ramakrishna 2002; Ramakrishna et al. 2002) is expected to be the norm. The high correlation of locus deletion and duplication rates with recombination rates suggests that erosion of synteny is particularly high in the high-recombination regions. This has been observed among wheat genomes (Akhunov et al. 2003a,b). The “Lego-like” model of grass genome evolution (Moore et al. 1995), by focusing attention on loci that are shared by syntenic blocks, fails to reflect the dynamic state of gene content within those blocks and the uneven rate of synteny erosion along chromosomes and thus fails to capture the true nature of grass genome evolution.
Experimental evidence for correlation of the rates with which genes are deleted and duplicated along chromosomes and recombination rate is currently limited to Triticeae genomes. Low-recombination regions of yeast chromosomes were shown to conserve synteny to a greater degree than regions of normal recombination rates, and this contrast was attributed to selection against recombination in genomic regions containing essential genes (Pal and Hurst 2003). We suggest that a more likely cause is that genes in low-recombination regions were subjected to lower rates of gene deletion and duplication during yeast genome evolution than those in regions with normal recombination rates. The existence of a similar relationship between recombination rate and synteny erosion rate in organisms as distant as grasses and yeast suggests that the relationships between recombination rate and gene deletion and duplication rates may be widespread among eukaryotes.
Footnotes
Footnotes
Communicating editor: J. Bruce Walsh
Acknowledgement
We thank K. R. Deal, P. E. McGuire, and B. S. Gaut for critical reading of the manuscript and A. R. Akhunov and P. Goines for assistance with DNA sequencing. This work was supported by the National Science Foundation under Plant Genome Research Program contract agreement no. DBI-9975989.
References
Akhunov, E. D., A. R. Akhunov, A. M. Linkiewicz, J. Dubcovsky, D. Hummel et al.,
Akhunov, E. D., J. A. Goodyear, S. Geng, L.-L. Qi, B. Echalier et al.,
Bennetzen, J. L.,
Bennetzen, J. L., and W. Ramakrishna,
Charlesworth, B., M. T. Morgan and D. Charlesworth,
Devos, K. M., T. Millan and M. D. Gale,
Devos, K. M., J. Dubcovsky, J. Dvorak, C. N. Chinoy and M. D. Gale,
Devos, K. M., J. K. M. Brown and J. L. Bennetzen,
Dvorak, J.,
Dvorak, J., and K. C. Chen,
Dvorak, J., and H. B. Zhang,
Dvorak, J., and H. B. Zhang,
Dvorak, J., P. di Terlizzi, H. B. Zhang and P. Resta,
Dvorak, J., A. D. Akhunov, A. R. Akhunov, M. C. Luo, A. M. Linkiewicz et al.,
Dvorak, J., Z.-L. Yang, F. M. You and M. C. Luo,
Echenique, V. C., B. Stamova, P. Volters, G. R. Lazo, V. L. Carollo et al.,
Gaut, B. S.,
Gaut, B. S., and J. F. Doebley,
Gale, M. D., M. D. Atkinson, C. N. Chinoy, R. L. Harcourt, J. Jia et al.,
Gaut, B. S., B. R. Morton, B. C. McCaig and M. T. Clegg,
Hasegawa, M., K. Kishino and T. Yano,
Huang, S., A. Sirikhachornkit, X. Su, J. Faris, B. S. Gill et al.,
Islam, A. K. M. R., K. W. Shepherd and D. H. B. Sparrow,
Kihara, H.,
Kimura, M.,
Langley, C. H., and W. Fitch,
Lazo, G. R., S. Chao, D. D. Hummel, H. Edwards, C. C. Crossman et al.,
Lukaszewski, A. J., and C. A. Curtis,
Lupski, J. R.,
Lynch, M., and J. S. Conery,
Maynard Smith, J., and J. Haigh,
McFadden, E. S., and E. R. Sears,
Michelmore, R. W., and B. C. Meyers,
Mickelson-Young, L., T. R. Endo and B. S. Gill,
Moore, G., K. M. Devos, Z. Wang and M. D. Gale,
Mori, N., Y.-G Liu and K. Tsunewaki,
Naranjo, T., A. Roca, P. G. Goicoechea and R. Giraldez,
Nathans, J., T. P. Piantanida, R. L. Eddy, T. B. Shows and D. S. Hogness,
Nesbitt, M., and D. Samuel,
Pal, C., and L. Hurst,
Posada, D., and K. A. Grandall,
Qi, L. L., B. Echalier, B. Friebe and B. S. Gill,
Qi, L. L., B. Echalier, S. Chao, G. R. Lazo, G. E. Butler et al.,
Ramakrishna, W., J. Dubcovsky, Y. J. Park, C. Busso, J. Embereton et al.,
Rodriguez, F., J. L. Oliver, A. Marin and J. R. Medina,
Sarkar, P., and G. L. Stebbins,
Sorrells, M. E., C. M. La Rota, C. E. Bermudez-Kandianis, R. A. Greene, R. Kantety et al.,
Swofford, D. L.,
Tamura, K., and M. Nei,
Tuleen, N. A., and G. E. Hart,
Umezu, K., M. Hiraoka, M. Mori and H. Maki,
Vicient, C. M., A. Suoniemi, K. Anamthawat-Jonsson, J. Tanskanen, A. Beharav et al.,
Zdobnov, E. M., and R. Apweiler,
