


Abstract
To assess the usefulness of linkage disequilibrium mapping in an autogamous, domesticated species, we have characterized linkage disequilibrium in the candidate region for xa5, a recessive gene conferring race-specific resistance to bacterial blight in rice. This trait and locus have good mapping information, a tractable phenotype, and available sequence data, but no cloned gene. We sampled 13 short segments from the 70-kb candidate region in 114 accessions of Oryza sativa. Five additional segments were sequenced from the adjacent 45-kb region in resistant accessions to estimate the distance at which linkage disequilibrium decays. The data show significant linkage disequilibrium between sites 100 kb apart. The presence of the xa5 resistant reaction in two ecotypes and in accessions with different haplotypes in the candidate region may indicate multiple origins or genetic heterogeneity for resistance. In addition, genetic differentiation between ecotypes emphasizes the need for controlling for population structure in the design of linkage disequilibrium studies in rice.
THE ability to interpret patterns of molecular genetic diversity and to relate them to phenotypic variation will enhance the use of diverse genetic resource collections in crop improvement. Recently, a primary goal in genetic resource management has been to characterize the structure of diversity within a crop species (Brown 1989). Increasingly, the focus is shifting to dissecting and understanding diversity in relation to genes underlying agronomic traits (Buckler and Thornsberry 2002; Rafalski 2002).
One possible approach to building the connection from genetic diversity to phenotype is linkage disequilibrium (LD) mapping, recently proposed as an alternative to traditional methods for mapping traits in plants (Buckler and Thornsberry 2002; Nordborg and Tavaré 2002). Linkage disequilibrium is defined as the nonrandom association of alleles, and it can result from population structure, selection, drift, or physical linkage. The physical extent of linkage disequilibrium around a gene determines the effectiveness of this approach, and it is the result of many factors, including the rate of outcrossing, the degree of artificial or natural selection on the gene or region of the genome, the recombination rate, chromosomal location, population size and structure, and the age of the allele under study. In cultivated species, the extent of linkage disequilibrium will also be shaped by human selection and the bottlenecks associated with crop dispersal beyond the center of origin.
Recent studies in maize and Arabidopsis have provided contrasting results for the utility of linkage disequilibrium for fine mapping genes in plants on the basis of divergent estimates for the extent of linkage disequilibrium in these two plant genomes. In maize, an outcrossing species, significant linkage disequilibrium was detected only within a range from 100 bp to 7 kb on the basis of analysis of several genic regions (Remington et al. 2001; Tenaillion et al. 2001; Thornsberry et al. 2001); in the autogamous species Arabidopsis thaliana, significant linkage disequilibrium persisted for 250 kb in a single region (Hagenblad and Nordborg 2002). Unlike maize, rice is predominantly autogamous, which is predicted to result in more extensive linkage disequilibrium, perhaps even genome-wide linkage disequilibrium. But in contrast to Arabidopsis, the domestication history of rice has presumably introduced numerous bottlenecks as well as diverse hybridization events followed by generations of selection for performance in diverse agricultural environments. Because many of the world's major crop species are autogamous, including many cereals, legumes, and Solanaceous species, the understanding of linkage disequilibrium in rice may assist in evaluating the utility of linkage disequilibrium mapping in other autogamous species. In this article we provide an analysis of linkage disequilibrium in the genomic region containing xa5, a bacterial blight resistance allele whose identity is still unknown. The gene was first reported by Petpisit et al. (1977) and is a recessive gene conferring race-specific resistance to Xanthomonas oryzae pv. oryzae. After its identification, subsequent screening of the genetic resources collection by the International Rice Research Institute (IRRI) resulted in a group of accessions with the xa5 reaction profile to a panel of isolates, which was designated the “DZ192 group,” named for the original donor of xa5 (DZ192) to breeding lines such as IR1545 and isoline IRBB5 developed at IRRI. The gene has been mapped to the short arm of chromosome 5 (Yoshimura et al. 1984) and was subsequently localized to a bacterial artificial chromosome of ∼136 kb (Yang et al. 1998) and to a region of ∼70 kb (Blair et al. 2003).
The xa5 resistance allele may be associated with only certain ecotypes of rice. Rice ecotypes are the result of intraspecific differentiation of Orzya sativa L. for diverse environmental conditions during the past 10,000 years since domestication (Khush 1997). Broad classification of rice into the subspecies indica and japonica fails to capture these evolutionarily distinct subgroups. For example, indica rices have traditionally included the aus, aman, and boro rices of Bangladesh as well as the tjereh rices of Indonesia. Within the japonica subspecies are the Japanese ecotype nuda and the Indonesian ecotype bulu (Takahashi 1997). Allelism tests that showed xa5 to be in higher frequency in rice accessions from Bangladesh and Nepal than from other Asian countries also suggested that xa5 might be associated specifically with the aus and boro ecotypes (Busto et al. 1990). The divergence among the aus, boro, and aman ecotypes of Bangladesh has been shaped by the wet and dry cycles of the growing season (Khush 1997). Although the xa5 resistance allele was found primarily in aus and boro ecotypes, the presence of the resistance allele was not assessed in light of a molecular genetic definition of ecotype that would provide the more precise evolutionary characterization required for statistical analysis. As noted previously, population structure resulting from ecotypic differentiation is critical because it could result in spurious associations in linkage disequilibrium analysis.
The objective of this research is to describe the diversity and the decay of linkage disequilibrium in one region of the rice genome. This region consists of a small telomeric area on the short arm of chromosome 5 that harbors xa5. Our goals were (1) to characterize the extent of linkage disequilibrium in the region containing xa5 in resistant accessions and to determine if it is possible to reduce the number of candidate genes, (2) to analyze haplotype diversity in the context of population structure to determine the distribution of the resistance allele among ecotypes, and (3) to make predictions about the allelic diversity underlying the xa5 phenotype.
MATERIALS AND METHODS
Plant material: The 114 rice accessions used in this study (listed in Table 1) were obtained from the IRRI in the Philippines and from the National Plant Germplasm System Small Grains Collection in Aberdeen, Idaho. A subset of the sample had previously been allele tested for xa5 (Olufowote et al. 1977; Sidhu et al. 1978; Singh et al. 1983); see Table 1. Plants were grown in a greenhouse and genomic DNA was extracted using a cetyltrimethylammonium bromide protocol (Colosi and Schaal 1993).
Bacterial blight inoculation and evaluation: Accessions were evaluated for their disease response at 60 days after sowing following inoculation with X. oryzae pv. oryzae (Xoo) isolates representing Philippine races one (PXO61), two (PXO86), and four (PXO71; Mew 1987). The inoculum was prepared as in Blair et al. (2003), except that the bacteria were cultured for 4 days on modified Wakimoto's medium. Inoculation was performed using the leaf-clipping method (Kauffmann et al. 1973). Three leaves were inoculated for each race, and different bacterial isolates were inoculated on separate tillers. IR24 and IRBB5 were included as susceptible and resistant controls, respectively. Plants were maintained in growth chambers with 11 hr of daylight, night temperatures of 28°, and day temperatures of 32°. Lesions were measured 14 days after inoculation. Lesion lengths generally showed a bimodal distribution, and this distribution was used as the basis for defining resistant and susceptible reactions. For typing of disease response, each plant was classified as resistant if the mean lesion length was between 0 and 3 cm. Plants with mean lesion lengths >6 cm were classified qualitatively as susceptible. Plants with lesion lengths intermediate to these two classes were classified as moderately resistant.
Markers: Twenty-one simple sequence repeats (SSRs) distributed on the 12 chromosomes of rice were employed to analyze population structure (RM11, RM14, RM105, RM109, RM152, RM174, RM202, RM206, RM215, RM225, RM228, RM230, RM232, RM235, RM259, RM317, RM335, RM400, RM481, RM467, and RM415; as summarized in Chen et al. 1997; Temnykh et al. 2000, 2001; http://www.gramene.org). This number of markers seemed reasonable because it has been shown that 15–20 unlinked SSRs are sufficient to detect population stratification in humans (Pritchard and Rosenberg 1999). In addition, 13 amplicons were analyzed for single nucleotide polymorphisms (SNPs) and used for haplotype and linkage disequilibrium analysis using primer pairs described by Blair et al. (2003) and summarized in Table 2.
PCR amplification: The SSRs and SNP amplicons were generated using the following PCR conditions: 95° for 4 min; 30 cycles of 94° for 1 min, 55° for 2 min, 72° for 2 min; and a 1-hr extension at 72° to promote nontemplate addition of adenine by Taq.
Genotyping: PCR products were size separated on 4% polyacrylamide gels using an ABI Prism 377 DNA analyzer (Applied Biosystems, Foster City, CA). SSRs were analyzed with GenScan 3.1.2 software (Applied Biosystems) and scored with Genotyper 2.5 software (Applied Biosystems).
DNA sequencing: A total of 10 μl of quantified PCR product was treated with 10 units exonuclease I and 2 units shrimp alkaline phosphatase and incubated at 37° for 15 min followed by 80° for 15 min. Single-pass sequencing was performed by automated sequencing using an ABI Prism 3700 DNA analyzer (Applied Biosystems) at the Cornell BioResource Center (Ithaca, NY). Because rice is a diploid, predominantly selfing species and therefore predominantly homozygous, direct sequencing of PCR products resulted in a monomorphic sequence. Sequences were aligned using Sequencher 4.0.5 (Gene Codes, Ann Arbor, MI) for base calling and CLUSTAL W (Thompson et al. 1994) with manual quality control for insertion/deletions. The ends of fragments were trimmed to remove low-quality sequence. The resulting sequences are listed in Table 2, along with the putative gene content of each fragment on the basis of TIGR annotation (http://www.tigr.org). Singletons, SSRs, and polymorphisms resulting from the expansion/contraction of polyA and polyTs were eliminated
Rice accessions studied
| Accession name | Ecotype from passport data | Country of origin | IRGC no. or USDA no. (PI) |
|---|---|---|---|
| ARC5756a,b | Unknown | India | IRGC 20220 |
| Ashmber | Aman | Bangladesh | IRGC 27522 |
| Aus 449a,b | Unknown | Bangladesh | IRGC 29230 |
| Aus251a,b | Unknown | Bangladesh | IRGC 29043 |
| Aus32a,b | Unknown | Bangladesh | IRGC 28895 |
| Ausha Boro | Boro | Bangladesh | IRGC 27508 |
| Badal 1b | Aus | Bangladesh | IRGC 37362 |
| Bageria,b | Unknown | Nepal | IRGC 16193 |
| Bangaluwaa,b | Unknown | Nepal | IRGC 16268 |
| Bashiraj | Aman | Bangladesh | IRGC 26298 |
| Battiboro | Boro | Bangladesh | IRGC 37005 |
| Beri | Aus | Bangladesh | IRGC 25841 |
| Bhim Dhan | Unknown | Nepal | PI 596818 |
| Biolam | Aman | Bangladesh | IRGC 49070 |
| BJ1b,c | Unknown | India | IRGC 27526 |
| Boro | Boro | Bangladesh | IRGC 27511 |
| Boro | Aus and Boro | Bangladesh | IRGC 49159 |
| Burimural | Aus | Bangladesh | IRGC 49164 |
| Chandra Har | Aman | Bangladesh | IRGC 31754 |
| Chikon Shonib | Aus | Bangladesh | IRGC 64771 |
| Chinsurah Boro IId | Unknown | ||
| Cut Keureusek | Unknown | Indonesia | IRGC 66540 |
| DB3a,b | Unknown | Bangladesh | IRGC 8631 |
| Devarasia,b | Unknown | Nepal | IRGC 16173 |
| DF1a,b | Unknown | Bangladesh | IRGC 8365 |
| Dhan | Unknown | Nepal | PI 549215 |
| Dhariab | Aus | Bangladesh | IRGC 64773 |
| Dholai Moni | Boro | Bangladesh | IRGC 53492 |
| Dholi Boro | Boro | Bangladesh | IRGC 27513 |
| DL5a,b | Unknown | Bangladesh | IRGC 8593 |
| DNJ142a,b | Unknown | Bangladesh | IRGC 8426 |
| Dudhia,b | Unknown | Nepal | IRGC 16256 |
| Dumpja Kaap | Unknown | Bhutan | IRGC 64890 |
| DV139a,b | Unknown | Bangladesh | IRGC 8870 |
| DV29a,b | Unknown | Bangladesh | IRGC 8816 |
| DV32a,b | Unknown | Bangladesh | IRGC 8818 |
| DV85a,b | Unknown | Bangladesh | IRGC 8839 |
| DV86a,b | Unknown | Bangladesh | IRGC 8840 |
| DZ192b | Unknown | Bangladesh | PI 403366 |
| DZ78a,b | Unknown | Bangladesh | IRGC 8555 |
| Gariab | Aus | Bangladesh | IRGC 25854 |
| Ghuni Boro | Boro | Bangladesh | IRGC 27515 |
| Girresa | Unknown | Sri Lanka | IRGC 66512 |
| Gokhue Saier | Unknown | Nepal | IRGC 16195 |
| Janeri | Unknown | Nepal | PI 400662 |
| Jumli Marshi | Unknown | Nepal | PI 596816 |
| Jumula 2b | Unknown | Nepal | PI 400021 |
| Kal Shonib | Aus | Bangladesh | IRGC 64780 |
| Kaliboro 600a,b | Unknown | Bangladesh | IRGC 29367 |
| Kalo | Unknown | Nepal | PI 596824 |
| Karar Vadui | Aus | Bangladesh | IRGC 53527 |
| Katar Vadui | Aus | Bangladesh | IRGC 53527 |
| Kathmandu Valley no. 1 selection | Unknown | Nepal | PI 400718 |
| Kaun Kaek | Unknown | Cambodia | IRGC 22894 |
| Khagrai Digha | Aman | Bangladesh | IRGC 53530 |
| Koimuralib | Aus | Bangladesh | IRGC 49222 |
| Kumri Boro | Boro | Bangladesh | IRGC 27518 |
| Kuning | Unknown | Indonesia | IRGC 24999 |
| Laita Parsum | Aman | Bangladesh | IRGC 26388 |
| Lakhi Jhota | Aus | Bangladesh | IRGC 34711 |
| Lakhi Jhota | Aus | Bangladesh | IRGC 34711 |
| Laksmi Bilash | Aman | Bangladesh | IRGC 26705 |
| Laksmilotab | Aus | Bangladesh | IRGC 27564 |
| Lal Ahua,b | Unknown | Nepal | IRGC 16121 |
| Lal Chamarab | Aman | Bangladesh | IRGC 26499 |
| Lal Sara,b | Unknown | Nepal | IRGC 16185 |
| Lalaka Gadura,b | Unknown | Nepal | IRGC 16255 |
| Latu | Unknown | Indonesia | IRGC 18093 |
| Lekat Lembayung | Unknown | Indonesia | IRGC 66585 |
| Lua Lon | Unknown | Vietnam | IRGC 16719 |
| Machhapuchhre | Unknown | Nepal | PI 602664 |
| Mansat-3 | Unknown | Myanmar | IRGC 33341 |
| Maturya,b | Unknown | Nepal | IRGC 16190 |
| Meritam | Unknown | Indonesia | IRGC 18267 |
| Mery | Aus | Bangladesh | IRGC 34722 |
| Mery | Aus | Bangladesh | IRGC 34722 |
| Mimidam | Unknown | Bangladesh | IRGC 25897 |
| Mimidim | Unknown | Bangladesh | IRGC 25798 |
| Molladigha | Aus | Bangladesh | IRGC 25906 |
| Mudjaer | Unknown | Indonesia | IRGC 18296 |
| Myawutyi | Unknown | Myanmar | IRGC 33416 |
| Nakhia,b | Unknown | Nepal | IRGC 16254 |
| Narikel Jhupib | Unknown | Bangladesh | IRGC 64792 |
| Ngaja | Unknown | Bhutan | IRGC 64917 |
| Ngasein Kalagyi | Unknown | Myanmar | IRGC 33498 |
| Pakhi | Unknown | Nepal | PI 400664 |
| Pankiraja,b | Unknown | Bangladesh | IRGC 24139 |
| Phcar Tien P65 | Unknown | Cambodia | IRGC 23174 |
| PI180060-1a,b | Unknown | India | IRGC 3687 |
| Pidi Niyan Wee | Unknown | Sri Lanka | IRGC 66529 |
| Putuje | Unknown | Nepal | PI 391237 |
| Rabija | Unknown | Nepal | PI 596831 |
| Rakhoilb | Aus | Bangladesh | IRGC 64793 |
| Ratomansara | Unknown | Nepal | PI 549235 |
| Rerm Bilasha,b | Unknown | Nepal | IRGC 16273 |
| RP291-20b | Unknown | India | IRGC 40033 |
| Sada Niniya | Aman | Bangladesh | IRGC 53569 |
| Sajania,b | Unknown | Nepal | IRGC 16177 |
| Sampatti | Aus | Bangladesh | IRGC 25920 |
| Shaitan Dumra | Aus | Bangladesh | IRGC 25921 |
| Shoru | Aman | Bangladesh | IRGC 26523 |
| Sokan Dhana,b | Unknown | Nepal | IRGC 16250 |
| Tallya,b | Unknown | Nepal | IRGC 16146 |
| Tepi Boro | Boro | Bangladesh | IRGC 27519 |
| Thapachini | Unknown | Nepal | PI 420983 |
| Tolil14a,b | Unknown | Malaysia | IRGC 13836 |
| Trang Chum | Unknown | Vietnam | IRGC 16778 |
| Zaneli | Unknown | Nepal | PI 403534 |
from linkage disequilibrium and diversity analyses to exclude variation potentially introduced by sequencing error.
Analysis: Population structure was evaluated on the basis of three different analyses of genotypic data from the 21 SSRs: genetic distance, the model-based program “Structure” (http://pritch.bsd.uchicago.edu/), and FST (Wright 1969) implemented in Genepop software (http://wbiomed.curtin.edu.au/genepop/). Genetic distance was calculated using DC
Amplicon names, lengths, and matches to genes in the TIGR gene index
| Marker name | Length | Gene | Score | Function |
|---|---|---|---|---|
| RS1 | 148 | None | ||
| RS2 | 345 | None | ||
| RS4 | 283 | None | ||
| RS5 | 139 | None | ||
| RS6 | 254 | None | ||
| RS7 | 334 | None | ||
| RS8 | 250 | None | ||
| RS9 | 180 | None | ||
| RS11 | 321 | BE039874 | 245 8.5e-06 | Unknown |
| RS12 | 243 | None | ||
| RS13 | 363 | None | ||
| RS14 | 225 | None | ||
| RS15 | 367 | TC84724 | 261 2.1e-06 | Putative tRNA synthase |
| RS16 | 233 | TC92643 | 438 1.3e-14 | Unknown |
| RS17 | 217 | None | ||
| RS18 | 237 | TC93981 | 491 1.1e-17 | Unknown |
| RS19 | 239 | None | ||
| RS21 | 347 | BI807280 | 239 5.6e-06 | Unknown |
(Cavalli-Sforza and Edwards 1967). Phylogenetic reconstruction was based on the neighbor-joining method (Saitou and Nei 1987) implemented in PowerMarker, a free genetic analysis software package distributed by Kejun Liu (kliu2@unity.ncsu.edu). Linkage disequilibrium, diversity, and recombination analyses of sequence data were performed using SITES (http://lifesci.rutgers.edu/heylab/ProgramsandData/Programs/SITES/SITES_Documentation.htm) and dipdat software (http://home.uchicago.edu/rhudson1/source/misc/dipld/). Linkage disequilibrium was plotted as the squared correlation coefficient r2. The minimum set of recombination intervals was calculated as in Hudson and Kaplan (1985). Association tests were performed using Strat software (http://pritch.bsd.uchicago.edu/).
RESULTS
Significant divergence among ecotypes was found by using all measures for population structure. Distance-based analysis of 84 accessions detected two major clusters, as illustrated in Figure 1. Although ecotypic designation was not available for all accessions, enough samples of aus, boro, and aman ecotypes were available to anchor the ecotype identities of the clusters (Table 1). The first group consisted of the Bangladeshi indica rice ecotype called aman, breeding lines and landraces from Nepal of unknown ecotype, and a single accession from Malaysia, hereafter referred to as indica. The second group was populated by aus and boro ecotypes, mainly from Bangladesh and Nepal, as well as accessions of unknown ecotype.
Results from model-based analysis generally concur with the relationships determined by genetic distance analysis. In this study, the model-based analysis gave high significance levels for several theoretical population sizes, but the highest posterior probability was for a model with three populations. These results provided evidence for substructure within the indica group, formalizing the subclusters into two populations: one consisting mainly of aman ecotypes and another consisting of Nepali breeding lines. The third model-derived population corresponded to the aus-boro group of the distance-based analysis. Only four accessions differed in their population assignment by the two approaches; these were individuals that clustered with the indica's in the genetic distance analysis but were assigned to the aus-boro group in the model-based analysis.
When FST values were computed using the model-based population subdivisions for two and three populations (Table 3), they showed a high degree of population structure (overall FST for two populations = 0.89; overall FST for three populations = 0.85). There was a higher FST for the pairwise comparison of the aus-boro group with the indica group than between the two indica groups, indicating that the aus-boro subgroup was more differentiated from the indica groups than either was from the other. Because the sample size was small for the indica group and because several samples were breeding lines that were closely related, these two groups were treated as one for the remaining analyses. The population structure data support a hypothesis of hierarchical levels of divergence within rice, with greater divergence between the indica and aus-boro groups and no detectable divergence between the aus and boro ecotypes at this level of genomic resolution. This suggests that the divergence between the indica and aus-boro ecotypes is more ancient than that between the aus and boro ecotypes.
Analysis of the xa5 phenotype in relation to population structure analysis of the accessions confirmed the presence of xa5 in the Bangladeshi aus and boro ecotypes. Of the 45 resistant rice accessions for which genotypic information was available, all were assigned to the aus-boro subgroup except three accessions originating from Malaysia, Bangladesh, and Nepal (accessions Tolil 14, Lal Chamara, and Jumula 2). The presence of the xa5 phenotype outside of the aus-boro group could indicate gene flow or multiple origins.
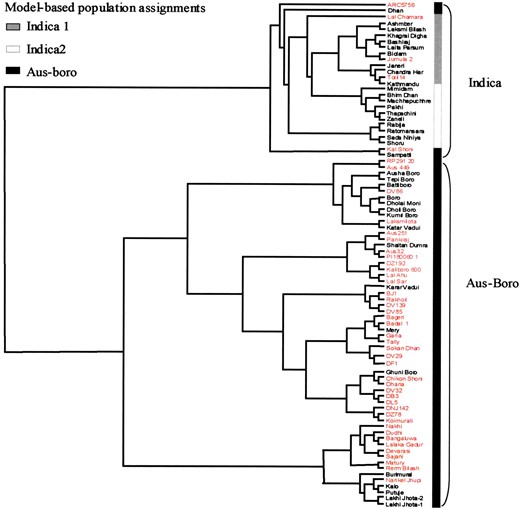
—Neighbor-joining tree of 84 rice accessions based on DC (Cavalli-Sforza and Edwards 1967) using 21 unlinked SSR markers. Resistant accessions are indicated in red.
Linkage disequilibrium in the 70-kb xa5 region was extensive but potentially informative in reducing the candidate region for xa5 described in Blair et al. (2003). Because the accessions showed significant population structure, indica's and aus-boro's were analyzed separately. Linkage disequilibrium, measured as r 2, showed significant linkage disequilibrium for the distal 45 kb of the candidate region for resistant accessions from both indica and aus-boro accessions (Figure 2), a pattern that was not observed in the susceptible groups. Association tests showed all sites to be equally significant due to the low frequency of recombination events in the haplotypes (data not shown).
A putative recombination event was detected on the distal side of the candidate region only, raising the question of how far linkage disequilibrium extended on the proximal side of the candidate region. To observe a decay of linkage disequilibrium, five additional amplicons spanning an additional 45 kb were analyzed in resistant
Overall and pairwise estimates of FST for 21 SSR loci, using model-based population subdivisions
| Subdivision | Indica | Overall | |
|---|---|---|---|
| Aus-Boro | 0.2103 | — | |
| Combined | — | 0.8914 |
| Subdivision | Indica | Overall | |
|---|---|---|---|
| Aus-Boro | 0.2103 | — | |
| Combined | — | 0.8914 |
| Subdivision | Indica 1 | Indica 2 | Overall |
|---|---|---|---|
| Indica 2 | 0.1762 | — | — |
| Aus-Boro | 0.2654 | 0.2462 | — |
| Combined | — | — | 0.8483 |
| Subdivision | Indica 1 | Indica 2 | Overall |
|---|---|---|---|
| Indica 2 | 0.1762 | — | — |
| Aus-Boro | 0.2654 | 0.2462 | — |
| Combined | — | — | 0.8483 |
accessions and added to the previous data set. Results confirmed that extensive linkage disequilibrium was present; r2 approaches 0.1 only after 100 kb (Figure 3).
Analysis of haplotype diversity for xa5 indicates that the xa5 resistance phenotype either derives from multiple origins or is genetically heterogeneous. Sequence diversity and haplotype structure were assessed in a larger sample of 114 accessions at 13 amplicons in the xa5 candidate region. Additional accessions not analyzed previously were included for two purposes: to serve as indica outgroups and to allow examination of possible additional sources of xa5. To this end, 12 accessions from Southeast Asia (Cambodia, Vietnam, Indonesia, and Myanmar) were included; all exhibited the xa5 phenotype reaction profile and had previously been identified as members of the DZ192 varietal group by IRRI. However, these accessions had not been allele tested for xa5.
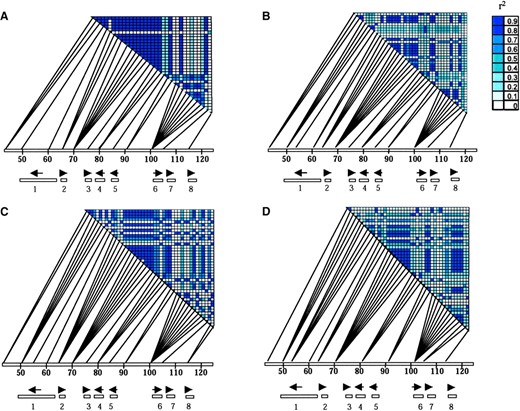
—Pairwise value for r2 between all pairs of SNP loci, analyzed by population and phenotype: (A) aus-boro resistant. (B) aus-boro susceptible. (C) Non-aus-boro resistant. (D) Non-aus-boro susceptible. The shade of blue indicates the value for r2. The position of each site in the candidate region is indicated by lines that connect the loci with a chromosomal segment, labeled with physical distance measured in kilobase pairs. Candidate genes, represented by numbered boxes below the chromosome segment, are 1, putative ABC transporter; 2, putative TFIIa small subunit; 3, putative 23.6-kD protein; 4, putative tRNA synthase; 5, putative 46.2-kD protein; 6, putative 61.5-kD kinase; 7, hypothetical 33.3-kD protein; 8, putative cysteine protease. Arrows indicate the direction of transcription.
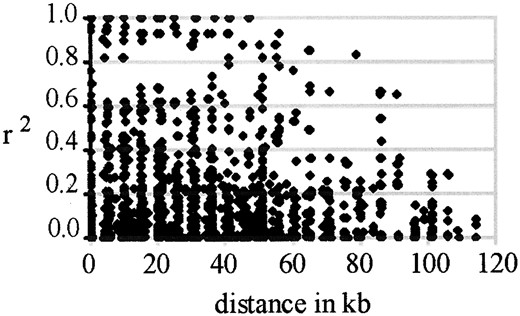
—The decay of linkage disequilibrium between all pairs of SNP loci in the region, shown as a function of the distance between the loci. Linkage disequilibrium was measured as r2.
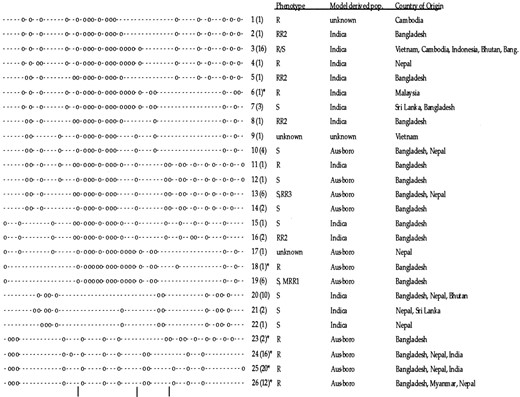
—Illustration of the 26 SNP haplotypes in the 70-kb candidate region for xa5. For each site, a dash represents the more common nucleotide, and a circle represents the more rare nucleotide. The vertical lines below indicate the predicted recombination intervals (Hudson and Kaplan 1985). The haplotypes are arranged in order of the tips of a neighbor-joining tree, so that more similar haplotypes are clustered. Numbers in parentheses indicate the number of accessions containing that haplotype. The phenotypes (R, all resistant; S, all susceptible; R/S, both resistant and susceptible accessions; RR2, resistant to Xoo race 2 only; RR3 resistant to Xoo race 3 only; MRR1, moderately resistant to Xoo race 1 only), the populations, and the countries of origin are listed to the right of the haplotypes. An asterisk indicates a haplotype present in accessions that had been allele tested.
Sixty-six variable sites (with insertion-deletions counted as a single site) in the 4725 bp of sequence from 13 amplicons in the xa5 region were observed, resulting in a frequency of one SNP per 100 bp. The 66 variable sites were organized into 26 distinct haplotypes in the 70-kb candidate region (Figure 4). Because of the great divergence between haplotypes and the absence of an outgroup to determine ancestral polymorphisms, it was not possible to build a single haplotype network to include them all (data not shown). Figure 4 displays the haplotypes in the order in which they appear in a neighbor-joining diagram. At total of 10 different haplotypes were present in resistant accessions. Haplotypes associated with resistance in the aus-boro ecotypes were very different from haplotypes associated with resistance in the indica ecotypes (Figure 4). A set of 4 highly similar haplotypes predominated in the aus-boro accessions that had been allele tested for xa5. This cluster of highly similar haplotypes (numbers 23, 24, 25, and 26) formed the bulk of xa5-containing accessions in the sample and includes DZ192, the original donor of xa5. A putative recombination event in haplotype 23, with a haplotype in higher frequency in susceptible accessions, suggests that the distal side of the candidate region is not involved in resistance. However, the possibility of recombination with the resistant (but not allele tested) haplotype 11 or of double recombination cannot be excluded. Furthermore, there were distinctive haplotypes in two allele-tested accessions, one from Malaysia and the other from Bangladesh. In addition to the major cluster of resistant haplotypes in the aus-boro group, allele-tested accession Aus 449 had a haplotype that was distinct from the others, and it was very similar (1/66 sites differed) to a haplotype found in accessions showing complete susceptibility or moderate resistance to Xoo race 1. Within phenotypically resistant non-aus-boro accessions that had not been allele tested for xa5, there were 4 additional related haplotypes, but there they are not supported by accessions that were allele tested for xa5, so this may indicate genetic heterogeneity for resistance.
In general, each haplotype was found in a single subpopulation, and frequently several closely related haplotypes were found in the same subpopulation. Haplotypes 1–9, 11, 15, 16, and 20–22 were found in indica ecotypes. Aus-boro accessions contained haplotypes 10, 12, 13, 14, and 23–26. The apparent restriction of a haplotype to a specific, genetically defined subpopulation did not preclude a wide geographical distribution. The detection of the global distribution of haplotypes was hindered because of the strategy to sample accessions from Bangladesh and Nepal, where the resistance allele was expected to be in highest frequency. However, the example of haplotype 3, which was present in rice collected from Vietnam, Cambodia, Indonesia, Myanmar, and Bangladesh, attests to the global spread of certain haplotypes and suggests that geographic origin may be a poor indicator of genetic distance.
The data showed a high-enough level of diversity both within and between populations for effective mapping and indicated a higher role for mutation than for recombination in generating the observed haplotype diversity. The sequenced amplicons containing the 66 variable sites were predominantly noncoding, although parts of five amplicons had significant matches to genes in the TIGR gene index (Table 2). Of the variable sites, 4 were insertion-deletions ranging in length from 1 to 33 bp and 62 were SNPs.
Variation in the xa5 region was similarly distributed between the indica and aus-boro ecotypes, despite the much larger sample size for the aus-boro's. Specifically, 50 sites varied within the aus-boro subpopulation and 53 sites within the indica's. The 13 additional variable sites were found in outgroups and nonallele-tested accessions of xa5. Many haplotypes (n = 11) differ from their most similar haplotype by a single site, indicating an important role for mutation in generating haplotype diversity. In contrast, the minimum set of recombination intervals is four, indicated in Figure 4. There is evidence for recombination only in haplotypes 7, 17, and 23.
DISCUSSION
The analysis of population structure underscores the need for genetic analysis of ecotypic differentiation if linkage disequilibrium and association mapping approaches are to be of value in rice improvement. The divergence between indica and aus-boro ecotypes detected by SSRs in the present study had been observed in previous studies employing isozymes (15 loci), amplified fragment length polymorphisms (AFLPs; 179 bands), and randomly amplified polymorphic DNAs (RAPDs; 35 bands; Glaszmann 1987; Zhu et al. 1998; Parsons et al. 1999). The mixing of aus and boro genotypes was noted in the isozyme and RAPD studies, but was not addressed in the AFLP analysis. The fact that 21 SSR markers give similar results to the other marker systems attests to the utility of multi-allelic, highly variable SSR markers for detecting population differentiation as well the depth of population structure in rice. It contrasts with an outcrossing species such as maize, with a different evolutionary history, where a greater number of markers may be required to detect population structure. It is interesting to note that the differentiation between aus and boro rices, which is meaningful in the farming system, is invisible with this low genomic resolution. This could indicate a recent divergence between aus and boro rices or continuing gene flow between them.
The frequency of nucleotide polymorphisms in this sample was 1 SNP per 100 bp. This is lower than that of maize, where the frequency of SNP polymorphism in US elite inbred germplasm was 1 SNP per 48 bp in noncoding regions and 1 SNP per 131 bp in coding regions (Bhattramakki et al. 2002). The estimate for SNP frequency in rice in this study is more similar to preliminary data from sorghum, which, like rice, has low outcrossing rates (Pedersen et al. 1998), where the estimated frequency is 1 SNP per 102 bp (average n = 25.45; M. Hamblin, personal communication). However, because this study included only a few indica's from outside of Bangladesh, and therefore represents a small sampling of their wide geographic range and no tropical or temperate japonicas or aromatic rices, the accessions included in this study do not represent the full diversity of rice. It is possible that different genomic regions and sampling will offer different views of both the frequency and the distribution of polymorphism and recombination.
Estimates of linkage disequilibrium are important as an indicator of how useful linkage-disequilibrium-based trait mapping approaches may be compared to other available methods on the basis of the tradeoff between population size and informativeness. If linkage disequilibrium declines rapidly, genome scans will require an excessive marker density, but the testing of candidate genes is feasible. If linkage disequilibrium is too large, resolution may be low, but genome scans are viable. The linkage disequilibrium decay at 100 kb observed in this study would require an average of one marker per centimorgan (1 cM = 200–300 kb; Feng et al. 2002; Sasaki et al. 2002), and these results suggest that linkage disequilibrium mapping strategies could provide greater resolution (because of the higher recombination rate) than primary quantitative trait locus (QTL) mapping, where populations with 200–300 individuals are typically surveyed with 150–200 markers and result in QTL typically 10–20 cM in size. However, to generate a whole-genome scan that captures the resolution offered by LD mapping, such a study would require the use of ∼1500 well-distributed markers. Thus, most applications of LD mapping are likely to be limited to regions previously delimited by QTL analysis or by candidate gene studies. In these cases, association mapping offers the advantage of exploring the relationship between phenotype and a broad array of genotypic variants at a favorable level of resolution in a specified target region. Because linkage disequilibrium is likely to extend beyond a single gene in rice, the application differs greatly from maize where genes already known to be associated with a trait can be tested to identify the functional nucleotide polymorphisms (Thornsberry et al. 2001). More studies will be required to determine if the extent of linkage disequilibrium reported here is typical of other subpopulations and loci in rice.
In this sample, significant linkage disequilibrium (r2 ≥ 0.1) persisted between sites up to 100 kb apart. This is the same order of magnitude as linkage disequilibrium observed at the FRIGIDA flowering time locus in A. thaliana, where significant linkage disequilibrium was detected between pairs of sites up to 250 kb apart (Hagenblad and Nordborg 2002; Nordborg et al. 2002). As expected, these estimates differ greatly from the limited linkage disequilibrium observed in outcrossing species like maize where linkage disequilibrium frequently decays at distances between 100 bp and 1.5 kb (Remington et al. 2001; Tenaillon et al. 2001; Thornsberry et al. 2001). In addition, it is possible that the xa5 locus is under selection and would therefore be predicted to have more extensive linkage disequilibrium than a locus evolving neutrally.
The resolution of the origin of xa5 and the allelic diversity for resistance was not possible with this data set. The xa5 phenotype was found predominantly within the genetically defined aus-boro subpopulation. However, the presence of the phenotype in a few accessions in the indica group raises the possibility of independent origins of this phenotype in different subpopulations, particularly when haplotypic data are considered. Within the aus-boro subpopulation one very common haplotype was associated with the xa5 reaction profile; however, very different haplotypes were associated with resistance in indica ecotypes.
Several lines of evidence suggest genetic heterogeneity for the resistance phenotype. For instance, some resistant, allele-tested accessions had haplotypes highly similar to susceptible accessions (compare haplotype 18 to 19 and haplotype 6 to 7). It is possible that the relevant differences lie in unsequenced regions and that recombination has not broken the linkage. These pairs of haplotypes could be useful for examining candidate genes for evidence of mutations because they would be expected to be highly similar at most positions. Another possibility is that susceptibility is being caused by another locus, because the Philippine Xoo races contain multiple avirulence (avr) proteins, which could interact with susceptibility alleles at other loci in the rice genome.
More evidence for genetic heterogeneity is that some non-allele-tested, resistant accessions from the presumed indica group originating in Southeast Asia have a haplotype that differs from the aus-boro resistant haplotype and is identical to some susceptible accessions. Because these accessions were not allele tested, it is possible that another locus confers the phenotype, a hypothesis that could be confirmed by genetic mapping. Alternately, it could be a different resistance allele at this locus; if the recessive nature of the gene is indicative of a knock-out mutation, the phenotype could be achieved by many possible nucleotide changes. Once again, it is also possible that the relevant mutation could be so recent that recombination has not occurred to sufficiently reduce linkage disequilibrium.
Genetic heterogeneity for a trait would require careful sampling if linkage disequilibrium and association mapping were to be employed. If alleles in rice have arisen after the diversification into subpopulations and their isolation has been enforced by limited gene flow, this situation would represent a violation of the common assumption for association mapping, the common disease common variant hypothesis, which proposes that common variants are responsible for the genetic risk for certain diseases (Lander 1996). This would reduce the power to detect the association between genotype and phenotype and suggests that larger sample sizes could be necessary. At this time, little information is available on the distribution of alleles in subpopulations of rice. In a study of the haplotype at the waxy locus that confers glutinous texture to rice, the glutinous haplotype was found mainly in temperate and tropical japonica's and in only a few indica accessions (Olsen and Purugganan 2002). This trait would be expected to be under strong selection due to cultural preference, so one might expect limited gene flow. It is not known how this would differ for traits affecting biotic or abiotic stress resistance.
A similar example of genetic heterogeneity was found for the early flowering FRIGIDA locus in Arabidopsis. The early flowering haplotype in Central Asia differs from that found in the rest of the early-flowering accessions (Hagenblad and Nordborg 2002), and eight independent loss-of-function mutations at this locus conferring early flowering have been identified (Le Corre et al. 2002). Both rice and Arabidopsis are predominantly autogamous, and therefore the expectation of a single origin of a phenotype that occurs across subpopulations may be less plausible than in outcrossing species. This has implications for sampling in future linkage disequilibrium or association studies. Isolated populations, employed in the study of human diseases, may find their plant counterpart in the subpopulations of autogamous crop species, which can have the advantage of a greater likelihood of having a single origin for a phenotype (Shifman and Darvasi 2001). However, because linkage disequilibrium may extend beyond a single gene, studies will require large sample sizes to capture rare recombination events.
Footnotes
Communicating editor: H. Ochman
Acknowledgement
The authors thank the International Rice Research Institute for providing rice accessions; Fumio Onishi for growth chamber assistance; two anonymous reviewers for valuable comments; Sharon Mitchell, Matthew Blair, Anjali Iyer, Alexandra Casa, Julie Ho, Martha Hamblin, Rebecca Nelson, and Ed Buckler for useful discussions; and Lois Swales for assistance with formatting the manuscript. A. Garris was supported by U.S. Department of Agriculture/Cooperative State Research Service competitive grant 97-35300-5101, representing Food and Agricultural Sciences National Needs Graduate Fellowship in Plant Biotechnology.
LITERATURE CITED
