


Abstract
We investigated the nucleotide variation of a conifer, Cryptomeria japonica, and the divergence between this species and its closest relative, Taxodium distichum, at seven nuclear loci (Acl5, Chi1, Ferr, GapC, HemA, Lcyb, and Pat). Samples of C. japonica were collected from three areas, Kantou-Toukai, Hokuriku, and Iwate. No apparent geographic differentiation was found among these samples. However, the frequency spectrum of the nucleotide polymorphism revealed excesses of intermediate-frequency variants, which suggests that the population was not panmictic and a constant size in the past. The average nucleotide diversity, π, for silent sites was 0.00383. However, values of π for silent sites vary among loci. Comparisons of polymorphism to divergence among loci (the HKA test) showed that the polymorphism at the Acl5 locus was significantly lower. We also observed a nearly significant excess of replacement polymorphisms at the Lcyb locus. These results suggested possibilities of natural selection acting at some of the loci. Intragenic recombination was detected only once at the Chi1 locus and was not detected at the other loci. The low level of population recombination rate, 4Nr, seemed to be due to both low level of recombination, r, and small population size, N.
RECENT progress in DNA sequencing techniques enables us to study details of genetic variation and divergence. Studies of polymorphism and divergence across several genes are still limited to a few model organisms, however. It is important to study genetic variation in various species in diverse taxa, since the effects of evolutionary factors are expected to differ among species. In the past, genetic variation in many plant species has been measured by electrophoresis. Hamrick and Godt (1990, 1996) summarized these allozyme data, paying attention to characteristics of the species such as life cycle, pollination system, seed dispersal, and mating system. They showed that these characteristics were indeed related to the amount and pattern of genetic variation.
In plants, nucleotide variation in nuclear genes has been studied well in herbaceous plants, especially in Arabidopsis and its relatives. These studies have provided us interesting information about these plants’ past population structures and natural selection (e.g., Innan et al. 1996; Filatov and Charlesworth 1999; Kawabe and Miyashita 1999; Stahl et al. 1999; Kuittinen and Aguadé 2000; Savolainen et al. 2000; Aguadé 2001); however, there has been only one such published report about woody plants (Dvornyk et al. 2002). Woody plants usually have a longer generation time, and thus the relative effects of mutation and selection may be different from those in herbaceous plants.
In this study, we surveyed nucleotide variation in a conifer, Cryptomeria japonica (called sugi in Japanese) and its divergence from Taxodium distichum var. distichum (bald cypress, distributed in the southeast parts of the United States). These species belong to Cupressaceae sensu lato, and the phylogenetic relationship of the family has been inferred from plastid DNA sequences (Gadek et al. 2000; Kusumi et al. 2000). Natural forests of C. japonica are distributed from Aomori Prefecture (40°42′N) to Yaku Island (30°15′N) in the Japanese Archipelago (Hayashi 1960), although the populations are presently discontinuous and scattered in limited areas due to past human exploitation. This species has a long generation time and sometimes lives more than a thousand years. It is mostly outbreeding and wind pollinated, like other gymnosperms. Hamrick and Godt (1990, 1996) reported that species having such characteristics showed low genetic differentiation. Indeed, low genetic differentiation among local populations (Fst ∼0.05) was reported using allozymes and cleaved amplified polymorphic sequence (CAPS) markers in this species (Tomaru et al. 1994; Tsumura and Tomaru 1999). While low genetic differentiation among populations has been observed, geographical variation of morphological traits (Murai 1947) and terpene components (Yasue et al. 1987) has been known to occur in this species. These studies suggested that the species was mainly divided into two groups, called Omote sugi (Pacific Ocean side type) and Ura sugi (Japan Sea side type). The discordance between morphological differentiation and genetic differentiation is an unsolved problem needing explanation in this species (Tomaru et al. 1994).
One of the advantages of studying C. japonica is that some information about the past population structure and mutation rate is available. First, Tsukada (1982), surveying fossil pollen data all over Japan, suggested that C. japonica retreated to a few refugia during the last glacial period and expanded its range rapidly after that. Retreat to refugia is not confined to the last glacial period. Miyoshi et al. (1999) showed that emergences of the pollens of the species corresponded to several interglacial periods extending back to 400,000 years ago, although only one location was examined in the study. Second, since this species is one of the most important timber species in Japan, humans have been exploiting it for thousands of years. As a result, natural forests of C. japonica have been reduced and now are distributed in limited areas. In addition, plantations were instituted several hundred years ago (Toda 1973; Ohba 1993). More recently, a massive plantation was begun after 1945. Currently this species occupies >45% of the artificial forests in Japan (one-eighth of the area of Japan). And finally, Kusumi et al. (2002) studied the molecular evolution of 11 nuclear loci in C. japonica and its related species. They found a large amount of variation in synonymous substitution rates among loci. Such knowledge will be helpful in the analysis of diversity patterns.
In this study, we investigated nucleotide variation at seven nuclear loci in three populations of C. japonica and the divergence from its closest relative, T. distichum. By analyzing variation at multiple loci from the same set of individuals, we aimed to separate locus-specific patterns from the patterns found across loci and assess the effects of selection, population structure, mutation, and recombination on the molecular evolution of this group of conifers.
MATERIALS AND METHODS
Samples: Since this species has been massively planted after 1945, we had to use care in our sampling. We collected seeds from the plus trees that have been kept in local seed orchards. The plus trees are elite trees that have favorable characteristics such as fast growth, pathogen resistance, and freeze resistance. The plus trees from which the seeds were taken mostly came from local artificial forests where seedlings have been used for plantation. Since the plus trees were generated before 1945, our samples are considered to represent the artificial forests before the massive plantation started after 1945. Samples were collected from three areas, Kantou-Toukai, Hokuriku, and Iwate, and the samples were considered to represent the Pacific Sea side (Omote sugi), the Japan Sea side (Ura sugi), and a northern part of the Pacific Sea side (Omote sugi) types, respectively (see Figure 1). Sixteen plus trees were chosen from each area, and seeds were taken from each tree. In some cases different seeds from the same mother tree were used for different loci.
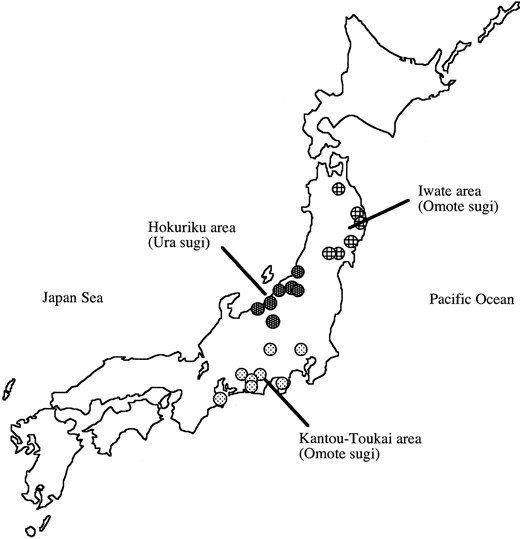
—Locations of origins of the plus trees. Locations of the forests from which the plus trees were collected are indicated by circles.
Loci: We investigated the nucleotide variation of 7 nuclear loci. Five of the 7 loci were chosen from the 11 loci studied by Kusumi et al. (2002). Primers for PCR amplification were those used for sequenced-tagged-site markers (Tsumura et al. 1997; our unpublished results) or were designed from the expressed sequence tag database by Ujino-Ihara et al. (2000). On the basis of homology, the 7 loci were considered to encode spermine synthase [Acaulis 5 (Acl5)], class I chitinase (Chi1), ferredoxin (Ferr), cytosolic glyceraldehyde-3-phosphate dehydrogenase (GapC), glutamyl-tRNA reductase (HemA), lycopene β-cyclase (Lcyb), and phosphoribosylanthranilate transferase (Pat), respectively. The Acl5 consisted of 10 exons (1-281, 370-436, 526-620, 710-812, 896-984, 1091-1247, 2214-2289, 2405-2463, 2555-2691, and 2775-2850), nine introns, and 3′ untranslated regions (UTR). The Chi1 consisted of a 5′ UTR (1-296), 3 exons (297-735, 845-992, and 1093-1468), and two introns. The Ferr consisted of an exon (1-345). The GapC consisted of 5 exons (1-25, 217-314, 1246-1388, 1475-1558, and 1660-1749) and five introns. The HemA consisted of an exon (1-1047). The Lcyb consisted of an exon (1-1575) and a 3′ UTR. The Pat consisted of an exon (1-573) and a 3′ UTR.
Molecular methods: Haploid genomic DNA was isolated from megagametophytes of each tree of C. japonica using the DNeasy plant mini kit (QIAGEN, Valencia, CA). In gymnosperms, megagametophytes are of maternal origin and haploid. Since the DNA samples are haploid, direct sequencing is straightforward and haplotypes can be easily determined. Seeds were sown on wet sterilized paper in a plastic plate. Seed coats and embryos were removed after germination. Using a pestle, we crushed a fresh megagametophyte in a 1.5-ml tube with Buffer AP1 of the DNeasy plant mini kit and then followed the manufacturer’s instructions for use of the kit. In total, ∼100 ng of DNA was obtained from a single seed. In addition to the primers used by Kusumi et al. (2002), we designed primers for PCR amplifications and for cycle sequencing reactions. All primers used for PCR amplifications are listed in Table 1. The PCR products were purified using Geneclean II (Bio101) or QiaQuick PCR purification kit (QIAGEN). products were directly sequenced for both strands on ABI Prism 377 or ABI Prism 3100 automatic sequencers using BigDye terminator cycle sequencing ready reaction kit ver. 2 or ver. 3 (PE Biosystems, Foster City, CA). For sequencing of the Acl5, Chi1, and Lcyb of T. distichum, we used one of the diploid DNA samples of Tsumura et al. (1999). We cloned PCR products amplified by PyroBest DNA polymerase (TaKaRa) into a pGEM T-easy vector (Promega, Madison, WI). We sequenced more than six clones and chose the most frequent haplotype for analyses. We used published data by Kusumi et al. (2002) for the Ferr, GapC, HemA, and Pat sequences of T. distichum (GenBank accession nos. AB075538, AB076715, AB075574, and AB076584).
PCR primers used to amplify the seven loci
| Loci | Primer sequences (5′-3′) | PCR conditionsa |
|---|---|---|
| Acl5 | AGAAGCAGTGGCAACAAATGG | 52°, 35 cycles |
| GTTAGAGGAGGAGTTACAAGCA | ||
| Chi1 | AAAGGCGAATGTGACGGAAAT | 51°, 35 cycles |
| CTGGATGATTTGCGGTGTCT | ||
| Ferr | TCTGCGGCTGTAGTTCCAGT | 58°, 35 cycles |
| ATAGGCGACGCAGGTCAAAA | ||
| GapC | TTTGGCATTGTTGAAGGTCT | 55°, 35 cycles |
| CAAATCTATGACTCGTGAAC | ||
| HemA | CTTCGGCAGCATCTCTTCAT | 55°, 35 cycles |
| AACCTTAGCCCTGATTTTCT | ||
| Lcyb | CAGTGTGGAAGCCGATTATGG | 54°, 35 cycles |
| GCTGTTGCCCATCTGTTGTTG | ||
| Pat | ATGTGTTGTCTGGCTTGGTA | 58°, 35 cycles |
| GGTGAACAAGAAAGGGAAAT |
Annealing temperature and number of PCR cycles are shown.
Mapping of the loci: Linkage maps of C. japonica have been constructed using CAPS and other molecular markers (Mukai et al. 1995; Nikaido et al. 2000; Iwata et al. 2001). The Ferr and Pat loci had been mapped previously, but the other five loci had not, so we mapped those loci by the pseudo-testcross method (Grattapaglia and Sederoff 1994). The segregation data were analyzed together with other markers using JoinMap (CPRO-DLO). The Acl5 and HemA loci could not be mapped because of the lack of suitable polymorphisms. The Chi1 and Lcyb were mapped onto the same linkage group, and the map distance between them was ∼75 cM. The Ferr, GapC, and Pat were mapped to different linkage groups, respectively.
Data analysis: DNA sequences were aligned manually. Analyses of sequence data (estimators of nucleotide variation, recombination rate, and gene flow; test of linkage disequilibrium; statistics for tests of neutrality; and coalescent simulations) were performed using DnaSP ver. 3.53 (Rozas and Rozas 1999). We wrote a coalescent simulation program to obtain the P values of a test for detecting population growth, R2 (Ramos-Onsins and Rozas 2002), by modifying the program described by Hudson (1990). We used sequences of T. distichum, one of the closest relatives of C. japonica, to perform the Hudson-Kreitman-Aguadé (HKA) test (Hudson et al. 1987) and McDonald-Kreitman (MK) test (McDonald and Kreitman 1991). Phylogenetic networks were drawn manually and using Network ver. 3.0 (Bandelt et al. 1999). Permutation tests for population subdivision among three areas were performed using programs described by Hudson (2000).
In addition, we tested goodness of fit of the observed frequency spectrum to that expected under the neutrality and panmixis with constant population size. Consider a polymorphic site with two types of nucleotides. Let i be the number of the rarer variants at this site, and designate the sample configuration of the site by [i:n-i] where n is the sample size. On the basis of sample configurations, we categorized polymorphic sites into three classes consisting of low-frequency (1:47 to 8:40), intermediate-frequency (9:39 to 16:32), and high-frequency (17:33 to 24:24) polymorphisms. We define as a test statistic, where Sj is the number of polymorphic sites that were categorized into the jth class and S¯j is its expected value. A coalescent simulation program modified from that by Hudson (1990) was made assuming the neutrality, panmixis, and constant population size. No recombination within a gene was assumed. A total of 10,000 replicate runs were executed to estimate S¯j and obtain the distribution of χ2 under the null hypothesis of the neutrality, panmixis, and constant size. For the simulation, we used the observed number of segregating sites, S, at each locus to condition the number of mutations and assumed that loci are unlinked.
RESULTS
Forty-eight alleles (16 for each area) were sequenced for each locus. We call the partial sequences at respective loci by their putative locus names. The polymorphic sites are summarized in Figure 2. While almost all of the polymorphic sites had two variants, two sites at the Lcyb locus (positions 972 and 1353) had, respectively, three variants each. They were excluded from the analysis of linkage disequilibrium and estimation of the minimum number of recombination events. We used the number of mutations, but not the number of segregating sites, for the estimations and tests. In addition, we excluded gaps in the following analyses. Haplotype networks were constructed on the basis of the sequences, and they are shown in Figure 3.
Population subdivision: Values of Fst estimated by the method of Hudson et al. (1992) are summarized in Table 2. Estimated Fst values range from -0.05587 to 0.1681, and their averages over loci between any pairs of the areas are <4%. Results of the test utilizing Snn (Hudson 2000) among three areas are also summarized in Table 2. Snn statistics were significant at the 5% level in three of the comparisons between two areas at the Acl5 and GapC loci. Although a few of the comparisons showed statistical significance, we found no clear tendency of population subdivision across loci. In addition, the averages of Fst across loci were low (Table 2). Hence, we regard the present samples of C. japonica as homogeneous and pool the data of the three populations in the following discussion.
Nucleotide variation: Statistics of nucleotide variation, S, π, and θw, are summarized in Table 3. The average of the nucleotide diversity, πsil, at silent sites over all loci was 0.00383. However, values of πsil varied among loci. The values of πsil ranged from 0.00017 at the HemA to 0.00813 at the Chi1. Values of θw at silent sites, θw_sil, were 0.00303 on the average and ranged from 0.00092 at the HemA to 0.00644 at the Chi1. Coalescent simulations were performed to obtain the probability that πsil is smaller or larger than the observed value at each locus when the parameter θ is assumed to be the estimated average of πsil per site across loci, 0.00383, using DnaSP ver. 3.53. Let π and θ be the corresponding values for the sequenced region of each gene. We obtained P(π≤ 0.00066|θ= 0.00383) = 0.0016 at the Acl5, P(π> 0.00813|θ= 0.00383) = 0.0501 at the Chi1, and P(π≤ 0.00017|θ= 0.00383) = 0.0507 at the HemA.
Summary of Fst and the P values of Snn statistics for population subdivisions
| Acl5 | Chi1 | Ferr | GapC | HemA | Lcyb | Pat | Averagea | |
|---|---|---|---|---|---|---|---|---|
| Fst | ||||||||
| KT-HR | 0.1681 | -0.0559 | -0.0549 | 0.0058 | 0.0000 | -0.0320 | 0.0667 | 0.0144 |
| KT-IW | -0.0389 | 0.0190 | 0.0083 | 0.0071 | 0.0000 | 0.0251 | 0.0465 | 0.0112 |
| HR-IW | 0.1181 | 0.0185 | 0.0573 | 0.0424 | — | 0.0299 | -0.0277 | 0.0398 |
| Snn | ||||||||
| KT-HR | 0.039* | 0.894 | 0.713 | 0.345 | 1.000 | 0.178 | 0.111 | |
| KT-IW | 0.274 | 0.130 | 0.472 | 0.040* | 1.000 | 0.117 | 0.359 | |
| HR-IW | 0.019* | 0.104 | 0.162 | 0.129 | 1.000 | 0.335 | 0.312 | |
| 3 areas | 0.007** | 0.257 | 0.341 | 0.037* | 1.000 | 0.294 | 0.165 |
*0.05 > P > 0.01; **0.01 > P.
Values at the HemA locus are excluded.
Summary of nucleotide variations at the seven loci
| Nonsynon. | Synon. | Introns | 5′ flanking | 3′ flanking | Silent | Total | |
|---|---|---|---|---|---|---|---|
| Acl5 | |||||||
| Length | 876.67 | 263.33 | 1700.00 | — | 52.00 | 2015.33 | 2892.00 |
| S | 0 | 0 | 7 | — | 0 | 7 | 7 |
| π | 0.00000 | 0.00000 | 0.00078 | — | 0.00000 | 0.00066 | 0.00046 |
| θw | 0.00000 | 0.00000 | 0.00093 | — | 0.00000 | 0.00078 | 0.00055 |
| Chi1 | |||||||
| Length | 731.35 | 231.65 | 209.00 | 294.00 | — | 734.65 | 1466.00 |
| S | 2 | 5 | 9 | 7 | — | 21 | 23 |
| π | 0.00022 | 0.00639 | 0.01174 | 0.00693 | — | 0.00813 | 0.00418 |
| θw | 0.00062 | 0.00486 | 0.00970 | 0.00536 | — | 0.00644 | 0.00354 |
| Ferr | |||||||
| Length | 267.00 | 78.00 | — | — | — | 78.00 | 345.00 |
| S | 1 | 2 | — | — | — | 2 | 3 |
| π | 0.00190 | 0.00704 | — | — | — | 0.00704 | 0.00306 |
| θw | 0.00084 | 0.00578 | — | — | — | 0.00578 | 0.00196 |
| GapC | |||||||
| Length | 329.83 | 108.17 | 1496.00 | — | — | 1602.17 | 1934.00 |
| S | 1 | 3 | 29 | — | — | 32 | 33 |
| π | 0.00013 | 0.00861 | 0.00606 | — | — | 0.00624 | 0.00519 |
| θw | 0.00068 | 0.00625 | 0.00437 | — | — | 0.00450 | 0.00384 |
| HemA | |||||||
| Length | 801.83 | 245.17 | — | — | — | 245.17 | 1047.00 |
| S | 0 | 1 | — | — | — | 1 | 1 |
| π | 0.00000 | 0.00017 | — | — | — | 0.00017 | 0.00004 |
| θw | 0.00000 | 0.00092 | — | — | — | 0.00092 | 0.00022 |
| Lcyb | |||||||
| Length | 1220.09 | 354.91 | — | — | 117.00 | 471.91 | 1692.00 |
| S | 8 | 5 (7)a | — | — | 1 | 6 (8)a | 14 (16)a |
| π | 0.00203 | 0.00436 | — | — | 0.00266 | 0.00394 | 0.00256 |
| θw | 0.00148 | 0.00444 | — | — | 0.00193 | 0.00382 | 0.00213 |
| Pat | |||||||
| Length | 433.33 | 139.67 | — | — | 209.00 | 348.67 | 782.00 |
| S | 2 | 1 | — | — | 2 | 3 | 5 |
| π | 0.00087 | 0.00289 | — | — | 0.00427 | 0.00372 | 0.00214 |
| θw | 0.00104 | 0.00161 | — | — | 0.00216 | 0.00194 | 0.00144 |
S is the number of segregating sites.
The number in parentheses is the number of mutations. At the Lcyb, two sites have more than one mutation.
Total divergence, K, silent divergence, Ksil, and replacement divergence, Krep, per site between C. japonica and T. distichum are summarized in Table 4.
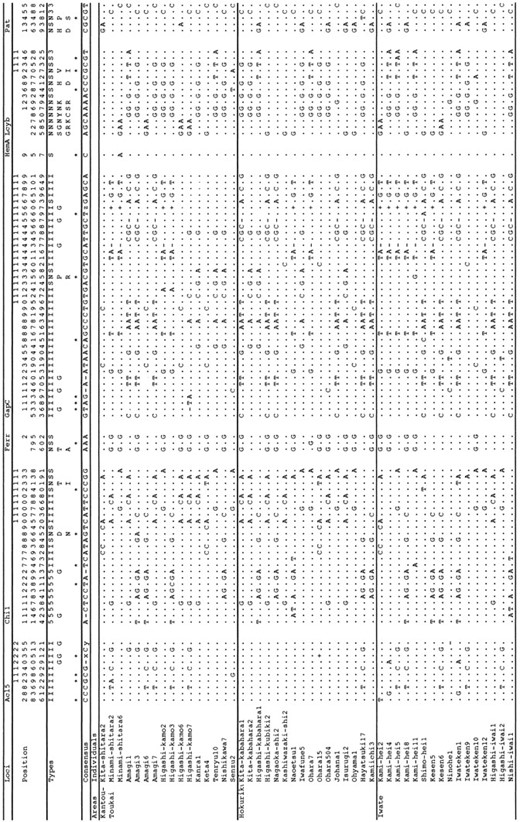
—A summary of polymorphic sites. The notations N, S, 5, 3, I, and G in Types denote nonsynonymous, synonymous, 5′ UTR, 3′ UTR, intron, and gap sites, respectively. For nonsynonymous polymorphic sites (type N), the majority and minority amino acids are shown below N using one-letter abbreviations. Asterisks indicate singleton sites. x, consensus sequence is (CTT)5 and + denotes (CTT)7 (from 2351 to 2370 at the Acl5); y, consensus sequence is (AG)3 and - denotes (AG)2 (from 2531 to 2536 at the Acl5); z, consensus sequence is 7-bp deletion and + denotes GTCTCGA (from 1607 to 1613 at the GapC).
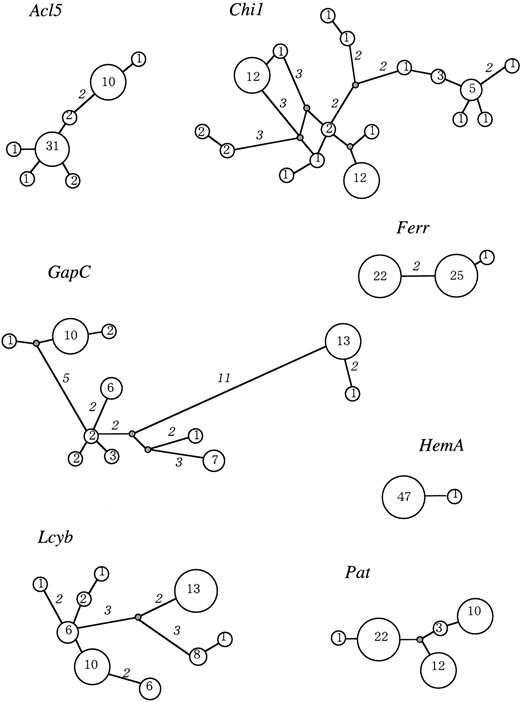
—Haplotype networks. Numbers in circles denote numbers of haplotypes. Italic numbers on the branches denote nucleotide substitutions between connected haplotypes, and branches without numbers have single substitutions.
Tests of neutrality: Values of Fu and Li’s F* and D* (Fu and Li 1993) and Tajima’s D (Tajima 1989a) are summarized in Table 5. No significant deviation from the neutral expectation was found. Three test statistics, Fs, rg, and R2, for detecting population growth are also summarized in Table 5 (Harpending 1994; Fu 1997; Ramos-Onsins and Rozas 2002). No significant deviations were found.
The frequency spectrum obtained from all polymorphic sites of the seven loci is shown in Figure 4. There were excesses of intermediate-frequency variants. The observed value of χ2 was 14.268 and P(χ2 ≥ 14.268) = 0.0122 under the neutral and panmictic model with constant size. The average and variance of χ2 under the null hypothesis were 3.000 and 9.810, respectively.
Summary of divergence between C. japonica and T. distichum
| Loci | ||||||||
|---|---|---|---|---|---|---|---|---|
| Acl5 | Chi1 | Ferr | GapC | HemA | Lcyb | Pat | All | |
| Total | ||||||||
| Length | 2769 | 1456 | 345 | 1922 | 1047 | 1692 | 775 | 10006 |
| K | 0.0545 | 0.0808 | 0.0638 | 0.0829 | 0.0135 | 0.0304 | 0.0259 | 0.0535 |
| Silent | ||||||||
| Length | 1896.98 | 730.67 | 77.99 | 1590.20 | 245.16 | 471.93 | 341.68 | 5354.58 |
| Ksil | 0.0774 | 0.1352 | 0.0965 | 0.1007 | 0.0464 | 0.0862 | 0.0452 | 0.0898 |
| Replacement | ||||||||
| Length | 871.70 | 725.33 | 267.01 | 329.82 | 801.84 | 1220.07 | 433.32 | 4649.10 |
| Krep | 0.0069 | 0.0297 | 0.0545 | 0.0031 | 0.0038 | 0.0099 | 0.0110 | 0.0135 |
P values of the multilocus HKA tests were 0.0620 at all sites and 0.1850 at silent sites. The results of multiple HKA tests are summarized in Table 6. Significantly lower polymorphisms were found at Acl5. A nearly significant excess of nonsynonymous polymorphisms was found at the Lcyb locus by the MK test (Table 7). This observation is supported by the low probability of finding the ratios of polymorphisms and fixed mutations if we compare the nonsynonymous variation at the locus against the synonymous or silent variation at all loci (Table 7).
Recombination: We tested the significance of linkage disequilibria for all pairs of polymorphic sites within and between loci, excluding sites with only singleton variation. While no pairs of sites that were located in different loci showed significant levels of linkage disequilibria after the Bonferroni correction, there were high levels of linkage disequilibria between pairs of sites within each locus (Figure 5). The minimum number of recombination events within each locus, RM, was estimated using Hudson and Kaplan’s (1985) method (Table 8). Values of RM were one at the Chi1 locus and zero at the other six loci. Estimates of the population recombination rate, C (=4Nr), by Hudson (1987) are summarized in Table 8. However, the values of C may be overestimated as Wall (2000) suggested. For example, if we use the estimated value of C = 0.0037 at the GapC locus, we obtain P(RM ≤ 0|θ= 0.00624, 4Nr = 0.0037) = 0.0091 using a coalescent simulation where the observed pairwise difference at the GapC was used as an estimate of the θ value. The estimate of RM was zero at this locus.
Summary of the results of neutrality tests at the seven loci
| Acl5 | Chi1 | Ferr | GapC | HemA | Lcyb | Pat | |
|---|---|---|---|---|---|---|---|
| Tajima’s D | -0.416 | 0.598 | 1.172 | 1.182 | -1.107 | 0.633 | 1.189 |
| Fu and Li’s D* | -1.073 | 0.423 | -0.402 | 0.633 | -1.829 | -0.138 | 0.144 |
| Fu and Li’s F* | -1.014 | 0.574 | 0.083 | 0.984 | -1.875 | 0.146 | 0.548 |
| Fs | -1.067 | -1.602 | 2.223 | 5.335 | -1.602 | 1.809 | 1.390 |
| P(Fs ≤ obs.)a | 0.355 | 0.323 | 0.902 | 0.956 | 0.245 | 0.806 | 0.811 |
| rg | 0.210 | 0.065 | 0.637 | 0.090 | 0.842 | 0.028 | 0.239 |
| P(rg ≤ obs.)a | 0.772 | 0.710 | 0.918 | 0.935 | 0.755 | 0.122 | 0.733 |
| R2 | 0.093 | 0.130 | 0.176 | 0.150 | 0.143 | 0.132 | 0.166 |
| P(R2 ≤ obs.)a | 0.376 | 0.782 | 0.889 | 0.912 | 0.672 | 0.782 | 0.866 |
values of the statistics under the assumptions of neutrality, constant size, panmixis, and no recombination within the gene, with fixed numbers of mutations. obs., observed value.
DISCUSSION
DNA samples: In this study, we used DNA samples from artificial forests. Since our samples were obtained from plus trees that have been propagated locally by seedlings and that were planted before the massive plantations started after 1945, we consider them to represent old artificial forests and hopefully to reflect natural populations. Indeed, Tomaru et al. (1994) reported that the genetic diversity among plus trees measured by protein electrophoresis was similar to that in natural populations. However, humans have been planting this species for several hundred years and effects of old human plantations are difficult to assess. As discussed below, a past reduction of population size was indicated from our data and this polymorphism pattern may be specific to samples from artificial forests. To examine this issue, we need to investigate samples from natural populations and we are currently analyzing diploid DNAs obtained from natural forests.
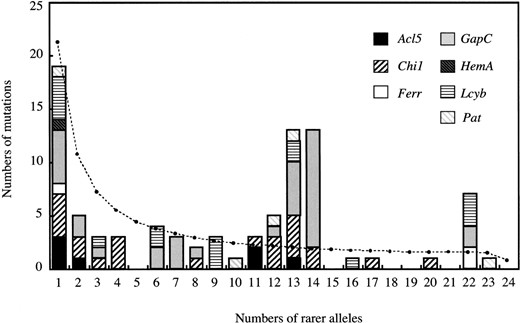
—The frequency spectrum of the nucleotide polymorphisms obtained from all polymorphic sites at the seven loci. Broken line shows expected values based on a coalescent simulation assuming the neutrality, random mating, and constant size (see text).
Amount of DNA variation: The mean of the silent nucleotide diversity, πsil, across all loci was 0.00383. This value is higher than that in humans (e.g., ∼0.001; Nachman et al. 1998), similar to that in Scots pine (0.0049 at the pal1; Dvornyk et al. 2002), and lower than those in Drosophila (e.g., 0.0134 in Drosophila melanogaster and 0.0377 in D. simulans; Moriyama and Powell 1996) and Arabidopsis (0.01 in amplified fragment length polymorphism data of Miyashita et al. 1999). However, the values varied among loci and ranged from 0.00017 to 0.00813. The Ksil values between C. japonica and T. distichum also varied and ranged from 0.0452 to 0.1352. Kusumi et al. (2002) also reported large variation of synonymous substitution rates among 11 loci in Cupressaceae, which includes C. japonica.
Summary of P values of multiple HKA tests
| Acl5 | Chi1 | Ferr | GapC | HemA | LcyB | Pat | |
|---|---|---|---|---|---|---|---|
| Acl5 | 0.0053 | 0.0615 | 0.0049 | NS | 0.0002 | 0.0018 | |
| Chi1 | 0.0031 | NS | NS | NS | NS | NS | |
| Ferr | 0.0111 | NS | NS | NS | NS | NS | |
| GapC | 0.0068 | NS | NS | NS | NS | NS | |
| HemA | NS | NS | NS | NS | NS | NS | |
| Lcyb | 0.0050 | NS | NS | NS | NS | NS | |
| Pat | 0.0203 | NS | NS | NS | NS | NS |
P values for all sites (top right) and silent sites (bottom left) are shown. NS, P ≥ 0.10.
Population structures: Hamrick and Godt (1990, 1996), summarizing allozyme data from many plant species, concluded that outbreeding and wind-pollinated species generally have low levels of genetic differentiation among local populations. The observed low values of Fst are consistent with this general observation. Similar results were also obtained in natural populations of this species using allozyme and CAPS markers (Tomaru et al. 1994; Tsumura and Tomaru 1999). Almost the whole range of C. japonica was surveyed in these two studies. Thus, the present population of C. japonica seems to be nearly panmictic.
However, excesses of intermediate-frequency variants were observed across loci and this pattern could not be explained by the panmictic model with constant population size. Thus, we need to consider some past demographic events to explain the observation. One hint comes from the tendency of Tajima’s D across loci. If we exclude the data of Acl5 and HemA where we found very low levels of variability, all Tajima’s D values were positive (Table 5). This pattern appears if population size was recently reduced (Tajima 1989b, 1995). This pattern would persist even if an expansion occurred afterward until singleton mutations accumulate in the population. In this case, we expect to observe excesses of intermediate-frequency variants. Therefore, one explanation for the excesses of intermediate-frequency variants is that there was a reduction of population size in a recent past. Fossil pollen data suggest that there was a size reduction in this species during the last glacial period that persisted ∼20,000 years (Tsukada 1982; Takahara 1998). Also, artificial forests were grown using seeds from natural populations at some points in the past and certainly have experienced size reductions. Currently, we cannot specify when the reduction occurred or what caused it but surveys of linkage disequilibria among suitable markers may give information on the time frame of this event.
Summary of MK tests
| Loci | Replacement | Synonymous | Silent | P(Syn.) | P(Sil.) |
|---|---|---|---|---|---|
| Acl5 | |||||
| Polymorphic | 0 | 0 | 5 | — | 1.0000 |
| Fixed | 6 | 30 | 139 | (0.6045) | (0.6019) |
| Chi1 | |||||
| Polymorphic | 2 | 5 | 21 | 1.0000 | 0.3615 |
| Fixed | 20 | 36 | 85 | (0.7430) | (0.7544) |
| Ferr | |||||
| Polymorphic | 1 | 2 | 2 | 0.5375 | 0.5375 |
| Fixed | 13 | 7 | 7 | (0.6980) | (0.7040) |
| GapC | |||||
| Polymorphic | 1 | 3 | 32 | 1.0000 | 0.3425 |
| Fixed | 1 | 4 | 141 | (0.2560) | (0.2670) |
| HemA | |||||
| Polymorphic | 0 | 1 | 1 | 0.5385 | 0.5385 |
| Fixed | 3 | 11 | 11 | (1.0000) | (1.0000) |
| Lcyb | |||||
| Polymorphic | 8 | 7 | 8 | 0.0592 | 0.0516 |
| Fixed | 10 | 30 | 37 | (0.0030) | (0.0025) |
| Pat | |||||
| Polymorphic | 2 | 1 | 3 | 0.5385 | 0.5756 |
| Fixed | 4 | 7 | 14 | (0.1979) | (0.2101) |
| All | |||||
| Polymorphic | 14 | 19 | 72 | 0.2309 | 0.2842 |
| Fixed | 57 | 125 | 434 |
P(Syn.) and P(Sil.) are P values obtained by comparing replacement changes to synonymous and silent changes, respectively. Values in parentheses are P values obtained by comparing replacement changes at each locus to synonymous (silent) changes at all loci.
Intragenic recombination: The recombination rate is also an important parameter affecting patterns of DNA polymorphism. Low levels of recombination make hitch-hiking and background selection more effective (Maynard Smith and Haigh 1974; Kaplan et al. 1989; Begun and Aquadro 1992; Charlesworth et al. 1993). To compare recombination rates among species, we need good estimates of C = 4Nr. However, as Wall (2000) pointed out, estimators of C are biased and have very large variances when parameters θ and C are small (say, in the case of θ≤ 3 as in our case). Both lengths of sequences and the amount of variation here seem not enough to estimate C. Therefore, here we compare the minimum number of recombination events, RM, per informative site. In C. japonica, only one intragenic recombination event was detected at the Chi1 locus. In other species, intragenic recombination events were detected more frequently. Values of RM per informative site at seven loci in Arabidopsis thaliana (0.08-0.15, Kuittinen and Aguadé 2000) are larger than those in C. japonica (the highest value being 0.0526 at Chi1). Note that A. thaliana is mostly selfing and thus seems to have very low effective recombination rates. Therefore, the population recombination rate, C = 4Nr, of C. japonica seems to be very low. This indicates that either the recombination rate between adjacent sites is low or the population size in C. japonica is small compared to that in A. thaliana.
In fact, the recombination rate between adjacent sites in C. japonica is lower than that in A. thaliana. The genome size of C. japonica is 22.09 pg per diploid genome (Hizume et al. 2001), corresponding to ∼105 Mb per haploid genome. Its genome size is 100 times larger than that of A. thaliana. On the other hand, estimates of the total map distance of C. japonica range from 1109.1 cM (Iwata et al. 2001) to 1992.3 cM (Nikaido et al. 2000), depending on the types of markers used. Even if we take the larger value of 2000 cM, the total map distance of C. japonica is only 3 or 4 times larger than that of A. thaliana (∼600 cM; http://nasc.nott.ac.uk/newrimap.html). The recombination rate between adjacent sites is estimated to be about one-thirtieth of that in A. thaliana on the average.
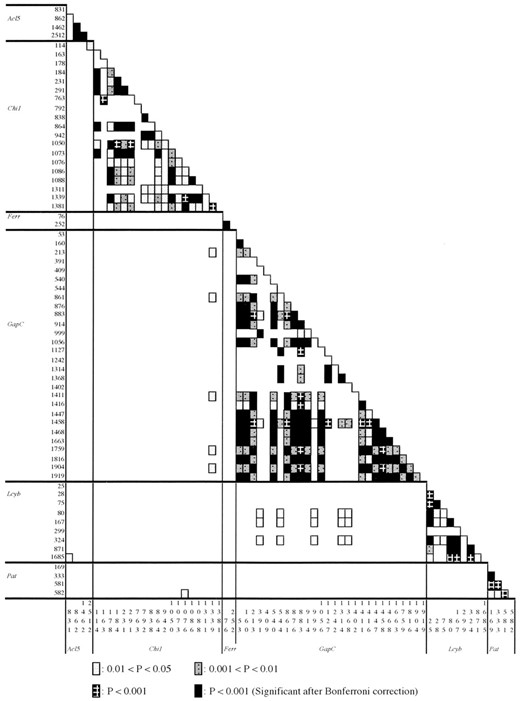
—Statistical significance of linkage disequilibria among informative sites. There were no informative sites at the HemA.
Summary of statistics for intragenic recombinations at the seven loci
| Acl5 | Chi1 | Ferr | GapC | HemA | Lcyb | Pat | |
|---|---|---|---|---|---|---|---|
| Length | 2092 | 1466 | 345 | 1934 | 1047 | 1692 | 782 |
| RM | 0 | 1 | 0 | 0 | 0 | 0 | 0 |
| No. of informative sites | 4 | 19 | 2 | 28 | 0 | 9 | 4 |
| RM/no. of informative sites | 0.0000 | 0.0526 | 0.0000 | 0.0000 | — | 0.0000 | 0.0000 |
| C | 0.0003 | 0.0123 | 0.0137 | 0.0037 | — | 0.0066 | 0.0335 |
| C per gene | 0.8 | 18.0 | 4.7 | 7.2 | — | 11.1 | 26.2 |
Recently, Dvornyk et al. (2002) reported nucleotide variation at the pal1 locus in a conifer, Pinus sylvestris (Scots pine). Interestingly, while the level of nucleotide variation in Scots pine was similar to the average in C. japonica, the estimate of RM from their data was 2, and RM per informative site at the pal1 locus in Scots pine was 0.25, which is much higher than the equivalent measurements in C. japonica. Pines are known to have even larger genome sizes than C. japonica, and the total map distance is reported to be similar to that of C. japonica (Chagne et al. 2002). To explain the different levels of population recombination parameter and the similar levels of nucleotide diversity in Scots pine and C. japonica, we invoke the smaller population size and higher mutation rate in C. japonica. While the distribution of C. japonica is restricted to Japan, Scots pine is widely distributed in the Eurasian continent and thus is expected to have a larger population size than C. japonica. Kusumi et al. (2002) reported that the average synonymous substitutions per site among Taxodioideae including C. japonica and Sequoioideae, whose putative common ancestor Parataxodium appeared from the Cretaceous (Arnold and Lowther 1955), was 0.387 while that between two Pinus species that diverged in the Cretaceous was 0.0357 (Table 6 of Dvornyk et al. 2002). Hence, the mutation rate in Pinus is about one-tenth of that of Cupressaceae. Although we need more data in both species groups to draw any definite conclusion, the contrasting patterns found in the two species groups of conifers seem to reflect differences of genetic and demographic parameters.
Possibility of natural selections: Significantly low levels of polymorphisms were observed at the Acl5 locus (Table 6). The pattern may be explained by a recent selective sweep at or near this locus (Maynard Smith and Haigh 1974; Kaplan et al. 1989). Negative values of D, D*, and F* statistics are also consistent with this hypothesis (Table 5). The Acl5 is homologous to the ACAULIS5 gene of A. thaliana, which encodes spermine synthase (Hanzawa et al. 2000). Spermine and other polyamines have been implicated in various plant growth and developmental processes (Kakkar and Sawhney 2002). Indeed acaulis5 mutants of A. thaliana showed defects in the elongation of stem internode (Hanzawa et al. 2000) but there have been no reports on the physiological roles of this gene in conifers. The indication of a selective sweep makes it worthwhile to investigate the physiological roles of this gene, for example, by measuring levels of expression of the gene and amounts of spermine in various tissues of C. japonica.
Excesses of replacement polymorphisms at the Lcyb locus were observed (Table 7). Although a nearly neutral mutation model with constant population size produces this pattern (Tachida 2000), replacement variants observed at this locus were not rare and this is inconsistent with the expectations of the model. We considered a few possibilities that may explain the pattern. First, the pattern may indicate that this locus became a pseudogene in C. japonica. However, the πrep/πsil ratio at this locus was 0.52, which indicates that this locus is still under the selective constraint (Table 4). Second, this gene might have experienced a recent relaxation of purifying selection. We note that five of the eight replacement polymorphic sites were found in the first 200 bp of the gene (Figure 2), which are not well conserved among species (data not shown). If nonsynonymous substitutions in this region are nearly neutral (Ohta 1992) and if a reduction of population size occurred recently in C. japonica as discussed previously, we may observe many replacement polymorphisms with intermediate-to-high variant frequencies in this region. Currently this explanation seems most plausible for the observation but we need to examine polymorphisms of this gene in other related species to evaluate its validity.
Acknowledgement
We thank M. Takahashi, Y. Moriguchi, H. Yomogida, S. Ito, M. Saito, and T. Kondo for their help collecting samples. We also thank N. Tani for his help in mapping. We thank M. Aguadé and two anonymous reviewers for their comments. This work was partially supported by grants from the Program for the Promotion of Basic Research Activities for Innovative Biosciences (PROBRAIN) and Uehara Memorial Foundation.
Footnotes
Sequence data from this article have been deposited with the DDBJ/EMBL/GenBank Data Libraries under accession nos. AB096270-AB096608, AB075538, AB076715, AB075574, and AB076584.
Communicating editor: M. Aguadé
LITERATURE CITED
