


Abstract
Although the analysis of linkage disequilibrium (LD) plays a central role in many areas of population genetics, the sampling variance of LD is known to be very large with high sensitivity to numbers of nucleotide sites and individuals sampled. Here we show that a genome-wide analysis of the distribution of heterozygous sites within a single diploid genome can yield highly informative patterns of LD as a function of physical distance. The proposed statistic, the correlation of zygosity, is closely related to the conventional population-level measure of LD, but is agnostic with respect to allele frequencies and hence likely less prone to outlier artifacts. Application of the method to several vertebrate species leads to the conclusion that >80% of recombination events are typically resolved by gene-conversion-like processes unaccompanied by crossovers, with the average lengths of conversion patches being on the order of one to several kilobases in length. Thus, contrary to common assumptions, the recombination rate between sites does not scale linearly with distance, often even up to distances of 100 kb. In addition, the amount of LD between sites separated by <200 bp is uniformly much greater than can be explained by the conventional neutral model, possibly because of the nonindependent origin of mutations within this spatial scale. These results raise questions about the application of conventional population-genetic interpretations to LD on short spatial scales and also about the use of spatial patterns of LD to infer demographic histories.
THE analysis of linkage disequilibrium (LD) plays a central role in many areas of population genetics, including the determination of genetic maps, ascertainment of levels of recombination at the population level, and estimation of effective population sizes. For populations in approximate drift–mutation–recombination equilibrium, the latter becomes possible with neutral markers because the expected levels of allelic association across loci can be expressed in terms of the population parameters θ = 4Neu and ρ = 4Ner, where Ne is the effective population size, u is the mutation rate per nucleotide site, and r is the rate of recombination between sites (Ohta and Kimura 1969; Hill 1975). In principle, if an estimate of r is available, the effective population size can be extracted from ρ (e.g., Hill 1981; Hayes et al. 2003; Tenesa et al. 2007), or vice versa. Unfortunately, the stochasticity of evolutionary processes generates enormous evolutionary variance for two-locus measures (Hill and Weir 1988), so a very large number of LD estimates from independent pairs of sites is required for meaningful inferences on ρ. Moreover, it has become increasingly clear that gene conversion causes a nonlinear relationship between ρ and physical distances between sites (Andolfatto and Nordborg 1998), raising questions about the very meaning of ρ.
With methods for whole-genome sequencing now well established, obtaining observations on large numbers of sites is no longer problematic. Although extending LD analysis to large numbers of individuals is still challenging (Maruki and Lynch 2014), it has been suggested that even a single individual, if sampled from a randomly mating population, can provide insight into genome-wide disequilibrium patterns (Lynch 2008). The proposed parameter, Δ, denoted as the “correlation of zygosity,” is a measure of the degree to which the spatial distribution of heterozygous sites deviates from the expectation under random segregation. Here, we consider the issues underlying this parameter in detail, first describing the observable single-individual measure in terms of the traditional population-level estimates of LD, then exploring the power of the proposed method, and finally summarizing the results of applications to the sequenced genomes of several vertebrate species. The empirical observations provide new insights into features of recombination that have been previously accessible with only a small number of model genetic organisms.
Theory
The correlation of zygosity, Δ
Consider all pairs of genomic sites separated by distance d within a single individual, and let π and (1 − π), respectively, be the fractions of heterozygous and homozygous sites within the individual. Provided two sampled sites are uncorrelated by descent, denoted by (1 − Δ) below, the probabilities of jointly homozygous and jointly heterozygous states are (1 − π)2 and π2, respectively. If the genotypes of the two sites are correlated, denoted by Δ, they are either both homozygous or both heterozygous with respective probabilities (1 − π) and π. After some simplification, it follows that the frequencies of jointly homozygous, jointly heterozygous, and mixed homozygous/heterozygous pairs of sites are respectively:
Relationship to population-genetic parameters
A more mechanistic understanding of Δ requires expressions for the expectations of the three two-site zygosity classes (H0, H1, and H2) in terms of the underlying population determinants. In the following, we adhere to the standard Wright–Fisher population-genetic model, with biallelic loci (individual nucleotide sites), random mating, and discrete generations with consecutive episodes of mutation, recombination, and gamete sampling. Mutation is assumed to occur at rate u per generation at each site, and the probability that a recombination event is initiated between sites is denoted as r.
As a check on the validity of the diffusion-theory approximation, we evaluated the average values of the two-site features derived from simulations of a Wright–Fisher model over the full range of per-site values of θ and ρ observed in eukaryotes (Lynch 2007). The agreement between the expectations of the theory and simulated data was excellent.
Relationship to population-level linkage disequilibrium
Interpretation of the recombination rate
Recombination events involve heteroduplex formations between homologous chromosomes, where nonmatching sites must be resolved by mismatch repair, which causes gene conversion. Inclusion of this factor in the definition of the recombination rate is essential because although all recombination events result in gene conversion, not all conversion events are accompanied by crossovers.
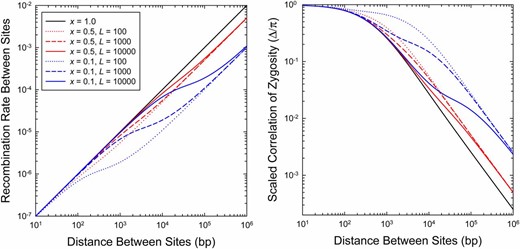
(Left) The relationship between the recombination rate between pairs of sites separated by distance d, given for two values of x (the fraction of recombination events resulting in crossing over), and three of (the mean gene-conversion-tract length). (Right) The relationship between the expected value of the scaled statistic Δ/π and the distance between sites, for the same values of x and . The results are obtained by using Equation 13a to define the distance-dependent recombination rate function and then applying this to Equation 6. In this particular example, Ne = 105 and u = c = 10−8.
Influence of population-size history
Because the population-genetic interpretations of Δ (and indeed all prior measures of LD) noted above are based on the assumption of a constant long-term population size, it is prudent to consider the potential effects of past demographic changes. This problem can be readily examined by use of the recursion equations presented by Strobeck and Morgan (1978), whose equilibrium solutions were referred to above. As in Figure 1, it is useful here to simply evaluate the behavior of the scaled correlation Δ/θ0, where θ0 denotes the current heterozygosity in the population, as this then leaves the influence of recombination as a separate term, e.g., Equation 8. (Recall from above that .) To further simplify the presentation, we also assume x = 1 in the following examples.
With populations with constant Ne, the scaled correlation converges on values of 1.0 for all Ne at short distances between sites, and then yields a set of parallel declining lines (on a logarithmic scale) at higher distances, with higher elevations associated with smaller Ne (Figure 2). This asymptotic behavior, which arises because Δ ≃ 1/(4Necxd) at large d, implies an expected inverse relationship between Δ and d at large distances.
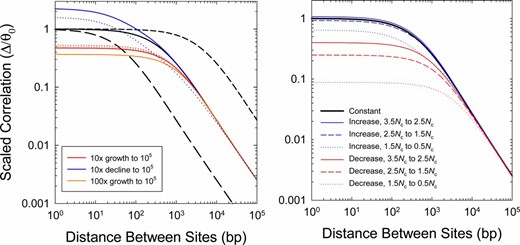
Effects of long-term demographic changes on the behavior of Δ, here scaled to the level of heterozygosity in the current population. (Left) Cases of continuous growth or decline in population size. The denoted changes initiate 4Nc generations in the past, where Nc is the current effective population size, starting with an ancestral population assumed to be in drift–mutation equilibrium using the expected values based on its size. Thick black lines denote three cases of constant population size, whereas colored lines denote cases of continuous population size change (solid for exponential change; dotted for linear change). (Right) Cases of abrupt but transient change in population size for intermediate periods of Nc generations, for various periods in the past. The ancestral population is assumed to have the same size as the current population and to have been in drift–mutation equilibrium. In all cases, the current effective population size is Nc = 105, with per-site mutation (u) and recombination (c) rates both equal to 10−8.
For populations changing in size, we considered demographic shifts within the past 4Nc generations, where Nc is the current effective population size. Because 4Nc is the mean coalescence time for a neutral mutation in a population of constant size, current patterns of LD will be negligibly influenced by demographic changes prior to this point. For populations declining in size progressively through time, the scaled correlation exceeds 1.0 at short distances between sites and then converges on the expected values for the current population size at large distances (Figure 2). In effect, continuously shrinking populations result in a situation in which LD at closely linked sites is elevated relative to the expectation for a constant-size population with the observed θc. Such behavior is a reflection of the fact that the current population, which encourages greater buildup of LD, retains old variation reflective of a larger Ne. Populations expanding in size exhibit the opposite pattern—scaled correlations <1.0 at the shortest distances, but again with values converging on the expectations for the current population size at large d. Linear rates of change yield slightly less extreme behavior than exponential growth/decline (Figure 2).
An abrupt but transient transition to a novel population size was also investigated. In this case, both a sudden population expansion or bottleneck results in a reduction in the scaled correlation relative to expectations for the current population size, except in the case of a very distant expansion, which only trivially increases Δ/θ0 (Figure 2). Again, large effects are noticeable only at short physical distances (<1 kb), with the results for larger distances reflecting the expectations for a constant population size Nc with observed θc, even though the latter is not the current equilibrium expectation 4Ncu because of the lingering influence of historical changes in Ne.
These results suggest that estimates of Δ at very short distances can be influenced by past population-size changes, although the particular patterns observed are not necessarily very diagnostic of the historical nature of change unless the temporal pattern is largely continuous. For example, depending on the magnitude of change, transient population expansions and bottlenecks can lead to qualitatively very similar behaviors. On the other hand, even with extreme demographic changes, estimates of Δ/π for pairs of sites separated by >1 kb closely reflect the expectations of an equilibrium population with the current size. Hence, at appropriate physical distances, Equation 8 provides informative insight into the recombinational properties responsible for the pattern of decline of Δ with d.
Estimation procedures
We now consider the practical issue of obtaining unbiased and minimum-sampling-variance estimates of Δ. Consider an idealized data set in which the raw reads for a single individual have depth of sequencing coverage n. With very high depths of coverage, the genotypic states at each locus can usually be determined essentially unambiguously from the consensus sequence (assuming proper alignment of sites). However, most high-throughput-sequencing methods are highly error prone, and most projects deploy a low enough level of sequence coverage per site that genotypic ascertainment is problematic. To deal with such problems, a maximum-likelihood (ML) procedure has been suggested for acquiring joint estimates of π and Δ that best explain the read data at the full collection of genomic sites, while simultaneously correcting for biases associated with sequencing errors (Lynch 2008).
Each of the ℓ terms is a function of the genome-wide nucleotide composition, binomial allelic sampling (in the case of heterozygotes), and the error rate (ε, itself a parameter to be estimated). Expressions for these terms were given previously as Equations 4a and 4b in Lynch (2008), where issues of bias were noted. In the intervening time, we have formulated modified expressions that greatly reduce the bias in the derived parameter estimates, even at low coverage.
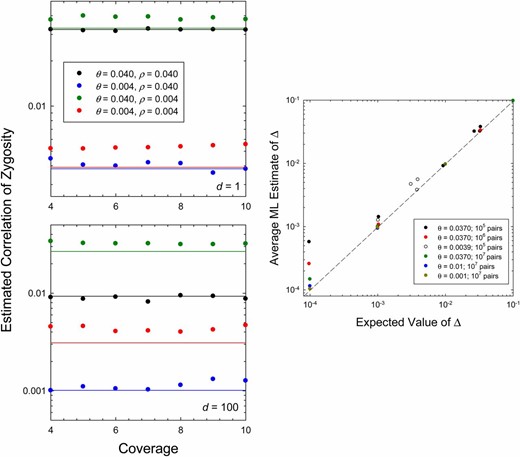
Mean ML estimates for Δ obtained from simulated data. In all cases, the effective population size is Ne = 106. On the left, it is shown that the mean ML estimates of Δ are independent of the level of sequence coverage per site; 200 replicate runs were made per condition, with 105–106 independent pairs of sites sampled in each case. The horizontal lines denote the expected values given by Equation 6. On the right, for 10× coverage, it is shown that mean estimates of Δ are asymptotically unbiased with increasing numbers of sites; as on the left, varying combinations of the per-site parameters θ and ρ underlie the individual points.
In practical applications of this method, computational efficiency can be dramatically enhanced by performing a first pass through the data in a univariate analysis to estimate π and ε (Lynch 2008). This then enables the precomputation of values of ℓ1 and ℓ2 for different quartets, which can be repeatedly reused in analyses performed over different distances. The estimates of Δ for each distance of interest can then be rapidly acquired in a second round of analysis from the ML estimates of H0 and H2. These and other refinements are now implemented in the program mlRho v. 2.2 (available at http://guanine.evolbio.mpg.de/mlRho/). Strictly speaking, the overall approach is equivalent to a composite-likelihood procedure, as not all pairs of sites are genealogically independent (although those on different chromosomes are expected to be, so that for species with n chromosomes, no more than a fraction ∼1/n of pairs of pairs will be nonindependent).
Empirical Observations
To obtain insight into the recombinational features of natural populations, we applied the preceding methods to single-genome sequences of several noninbred vertebrate species, all of which harbor enough sites to avoid issues of bias (Supporting Information, File S1). As discussed in Haubold et al. (2010), to avoid artifacts that might arise from paralogous regions (including repetitive DNAs such as mobile elements), such applications require the initial mapping of the full set of raw sequencing reads to the genome assembly, followed by the removal of any reads that map to more than one genomic location and also masking paralogous regions and any other sites that attract unusually large numbers of reads.
To illustrate some general issues, we initially focus on results for four human genomes (one archaic), after which we summarize further observations across the vertebrate phylogeny. In accordance with the expectations outlined in Figure 1, the decline in Δ with physical distance is strongly nonlinear in all genomes, even on a logarithmic scale, and this nonlinearity remains apparent at all scales of physical distance (Figure 4). Particularly striking are the high values and very rapid decline of Δ over distances <100 bp or so. As noted above, for the standard neutral model, Δ is expected to converge on the standing level of heterozygosity (π) as distance d → 1, but estimates of Δ at d < 100 are often an order of magnitude or more greater than the ML-derived estimates of π (Table 1). Potential reasons for such behavior are discussed below.
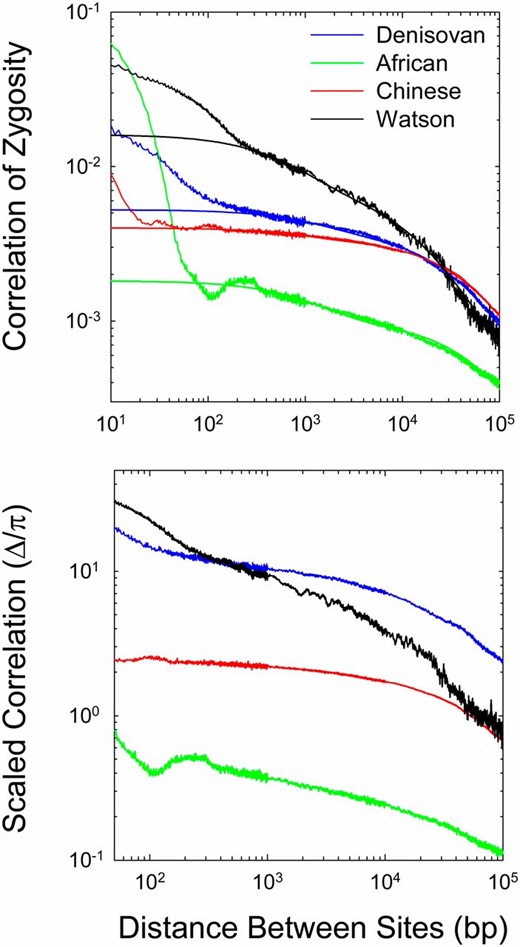
The decline of the correlation of zygosity (Δ) with physical distance between sites, given for an archaic human (Denisovan) and three modern humans (African, Chinese, and Watson). (Top) The smooth lines are the fitted functions using sites separated by 250 to 105 bp as described in the text (with the fitted parameters given in Table 1). (Bottom) Behavior of the correlation scaled by the estimates of heterozygosity within each genome.
Estimates of the features of recombination from the pattern of decline of Δ with physical distance between sites, derived from genomic sequences of single individuals of vertebrates (File S1)
| Species | θ | θ′ | ρ1 | x | |
|---|---|---|---|---|---|
| Primates | |||||
| Gorilla gorilla | 0.0031 | 0.0031 | 0.00057 | 0.067 | 3792 |
| Macaca mulatta | 0.0026 | 0.0149 | 0.00218 | 0.018 | 1068 |
| Pan troglodytes | 0.0010 | 0.0024 | 0.00033 | 0.177 | 4286 |
| Pongo abelii | 0.0053 | 0.0036 | 0.00062 | 0.043 | 5662 |
| P. pygmaeus | 0.0027 | 0.0047 | 0.00064 | 0.069 | 6852 |
| Homo sapiens (Archaic Denisovan) | 0.0004 | 0.0051 | 0.00022 | 0.235 | 3208 |
| H. sapiens (African) | 0.0036 | 0.0018 | 0.00064 | 0.066 | 1970 |
| H. sapiens (Chinese) | 0.0016 | 0.0039 | 0.00015 | 0.216 | 1833 |
| H. sapiens (Watson) | 0.0010 | 0.0161 | 0.00146 | 0.168 | 1389 |
| Nonprimate mammals: | |||||
| Ailuropoda melanoleuca | 0.0013 | 0.0018 | 0.00023 | 0.250 | 16267 |
| Canis familiaris | 0.0009 | 0.0082 | 0.00503 | 0.020 | 1183 |
| Loxodonta africana | 0.0013 | 0.0221 | 0.00286 | 0.021 | 1084 |
| Ornithorhynchus anatinus | 0.0013 | 0.1709 | 0.28970 | 0.025 | 608 |
| Nonmammalian vertebrates: | |||||
| Anolis carolinensis | 0.0026 | 0.0094 | 0.00214 | 0.058 | 1927 |
| Fugu rubripes | 0.0032 | 0.0042 | 0.00128 | 0.025 | 7238 |
| Petromyzon marinus | 0.0044 | 0.0061 | 0.00118 | 0.052 | 2863 |
θ′, an inferred estimate of 4Neu from the fit to Equation 8, not necessarily equivalent to the independently derived ML estimate given as θ); ρ1 = 4Nec, where c is the recombination rate between adjacent sites; x, the fraction of recombination events leading to crossovers; and , the mean conversion-tract length (in base pairs).
| Species | θ | θ′ | ρ1 | x | |
|---|---|---|---|---|---|
| Primates | |||||
| Gorilla gorilla | 0.0031 | 0.0031 | 0.00057 | 0.067 | 3792 |
| Macaca mulatta | 0.0026 | 0.0149 | 0.00218 | 0.018 | 1068 |
| Pan troglodytes | 0.0010 | 0.0024 | 0.00033 | 0.177 | 4286 |
| Pongo abelii | 0.0053 | 0.0036 | 0.00062 | 0.043 | 5662 |
| P. pygmaeus | 0.0027 | 0.0047 | 0.00064 | 0.069 | 6852 |
| Homo sapiens (Archaic Denisovan) | 0.0004 | 0.0051 | 0.00022 | 0.235 | 3208 |
| H. sapiens (African) | 0.0036 | 0.0018 | 0.00064 | 0.066 | 1970 |
| H. sapiens (Chinese) | 0.0016 | 0.0039 | 0.00015 | 0.216 | 1833 |
| H. sapiens (Watson) | 0.0010 | 0.0161 | 0.00146 | 0.168 | 1389 |
| Nonprimate mammals: | |||||
| Ailuropoda melanoleuca | 0.0013 | 0.0018 | 0.00023 | 0.250 | 16267 |
| Canis familiaris | 0.0009 | 0.0082 | 0.00503 | 0.020 | 1183 |
| Loxodonta africana | 0.0013 | 0.0221 | 0.00286 | 0.021 | 1084 |
| Ornithorhynchus anatinus | 0.0013 | 0.1709 | 0.28970 | 0.025 | 608 |
| Nonmammalian vertebrates: | |||||
| Anolis carolinensis | 0.0026 | 0.0094 | 0.00214 | 0.058 | 1927 |
| Fugu rubripes | 0.0032 | 0.0042 | 0.00128 | 0.025 | 7238 |
| Petromyzon marinus | 0.0044 | 0.0061 | 0.00118 | 0.052 | 2863 |
θ′, an inferred estimate of 4Neu from the fit to Equation 8, not necessarily equivalent to the independently derived ML estimate given as θ); ρ1 = 4Nec, where c is the recombination rate between adjacent sites; x, the fraction of recombination events leading to crossovers; and , the mean conversion-tract length (in base pairs).
The scaled correlations (obtained by dividing the ML estimates of Δ by the respective estimates of π) point to different past demographic histories of the sequenced humans (Figure 4). First, with the exception of the Watson sequence, the profiles are essentially parallel, with the estimates for the Chinese genome being elevated ∼7× relative to that for the African genome and the estimates for the Denisovan genome being elevated a further fourfold. As noted above, such behavior is indicative of an ∼30-fold larger long-term Ne in the recent ancestry of the African genome than in that of the Denisovan genome. The elevation of Denisovan estimates substantially >1.0 may imply a rapid ancestral decline in population size, whereas the estimates for the African genome are in better agreement with population stasis. The data for the Watson genome are qualitatively consistent with a current Ne similar to that for the Chinese genome, but with a dramatic decline from a large ancestral population size, possibly a consequence of an out-of-Africa bottleneck. Finally, we note that the expected inverse relationship between Δ and d is approached only at distances on the order of 105, which is indicative of a substantial amount of noncrossover recombination events even at large distances.
To obtain estimates of the recombination parameters ρ1 = 4Nec, x, and L, we generated least-squares fits to Equation 8 as a function of d, with Equation 13a used to define the recombination rate as a function of distance d. Because of the nonlinear nature of the relationship between Δ and d, some compromises need to be made in deriving such fits, as overreliance on short vs. long distances will bias the fits to the ranges of distances containing the most data. Our analyses involved estimates of Δ at 1-bp intervals up to sites 103 bp apart and pooled estimates for 10-bp windows for distances 103 < d ≤ 104 bp and for 100-bp windows for distances 104 < d ≤ 105 bp. The statistical analyses then sought the joint set of the four parameter estimates (θ, ρ1, x, and L) that minimized the mean-squared deviations of the logarithm of Δ from the model expectations. As the data for very short distances have features that apparently violate the assumptions of the model, these analyses were restricted to pairs of sites with distances in the range of 250 to 105 bp. As can be seen in Figure 4, the resultant fits provide an excellent description of this range of d.
Several tentative conclusions can be drawn from the fitted parameter estimates for these human genomes (Table 1). First, the estimated fraction of human recombination events resulting in crossing over is in the range of x = 0.066 to 0.235, with a mean of 0.171 (SE = 0.038). Second, estimates of ρ1 are in the range of 0.00015 to 0.0015, with a mean of 0.00062 (0.00030). Third, estimates of average conversion-tract lengths are in the range 1389–3208 bp, with a mean of 2100 (390).
Qualitatively similar results were obtained with analyses of five other primate genomes (Figure 5). Again, the estimates of Δ are aberrantly high at short distances between sites, and again the expected asymptotic inverse relationship between Δ and d is not attained even at a distance of 100 kb. When restricted to sites with d > 250 (>1000 in the case of chimpanzee, which exhibits aberrant behavior at smaller distances), the fit of Equations 8 and 13a to the data are again quite good. For this set of species, x has an average value of 0.075 (0.027), whereas the average value of is 4332 (976). Overall, the data on LD for distant sites suggest that recent effective population sizes are highest for Pongo abelii, lower for P. pygmaeus and Gorilla gorilla, still lower for Pan troglodytes, and lowest for Macaca mulatta. Although such estimates may seem discordant with the current day population sizes induced by recent human activity, the past few dozen generations are not expected to be sufficient to greatly influence standing levels of LD relative to the entire demographic history of the species. Results for additional vertebrates, summarized in Table 1, again consistently imply x < 0.25 and on the order of one to several kilobases.
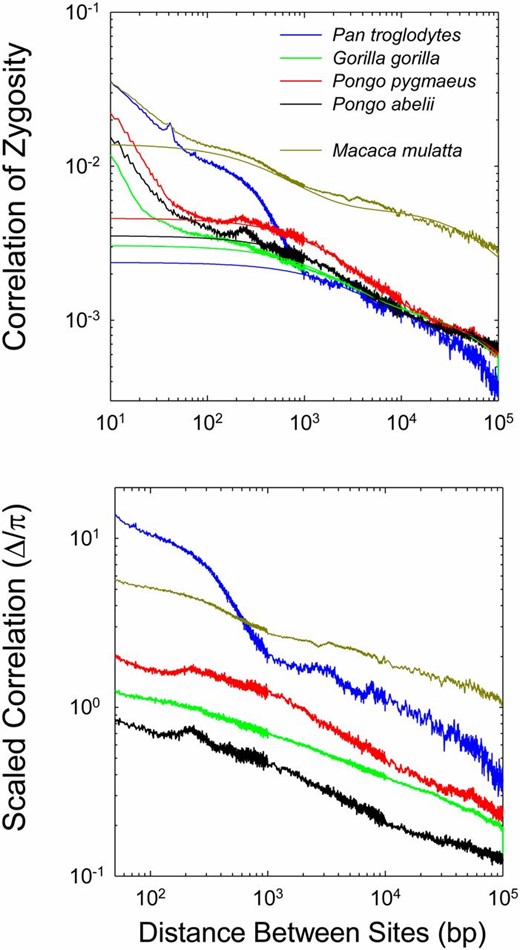
The relationship between the correlation of zygosity (Δ) and physical distance between sites for five nonhuman primate species. Details as in Figure 4.
The approach taken above is computationally intensive, involving well over 109 nucleotide sites for most analyses, which translates to orders of magnitude more pairs of sites depending on the sizes of the assembled contigs. Although not all pairs of sites are genealogically independent, the vast majority will be essentially so in vertebrates, which typically harbor a few dozen chromosomes approximately equal in size. Thus, the composite-likelihood approach appears to be justified statistically for individual estimates of Δ. The program mlRho computes the confidence interval around each estimate of Δ in the usual way by searching for positions of decline of two units on the likelihood surface; by solving Equation 8, this interval can then be translated into statistical bounds on the estimates of ρ. From the limited scatter of the data in Figure 4 and Figure 5 alone, it can be seen that with the magnitude of data available for vertebrate genomes, individual data points are quite reliable.
On the other hand, because estimates of Δ at close physical distances do share genealogical history, there is the issue of nonindependence along the distance profile. Such sampling covariance will be a function of not only the finite number of sites involved in an analysis, but also the evolutionary history of a population, and as a consequence no fully general statement can be made about the absolute magnitude of noise in a Δ profile that might be expected. However, to gain some insight into the matter of how variable Δ profiles might be among individuals, we consider two data sets.
First, we present empirical data on the Δ profile derived from 10 genomes of the microcrustacean Daphnia pulex, each derived from a different population (Figure 6). All 10 of these genotypes were extracted from populations known to be randomly mating on an annual basis and in Hardy–Weinberg equilibrium (Tucker et al. 2013). Despite the different population sources (ranging over several hundreds of kilometers), the Δ profiles are highly similar. Deviations become slightly larger at increasing physical distances because of declining sample sizes (and possibly recent differences in population-specific demographic histories).
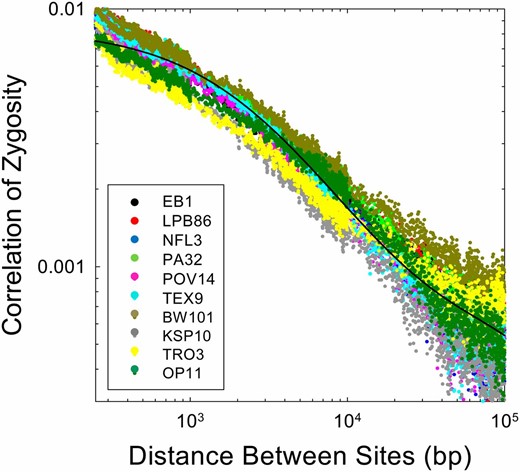
Observed patterns of decline of the correlation of zygosity with physical distance between sites for 10 natural isolates of Daphnia pulex, each derived from a different population (data are derived from Tucker et al. 2013 for sexual genotypes). The fitted curve is based on the average parameter estimates over all 10 isolates, each applied to data for pairs of sites >250 bp in distance.
The average estimate of θ = 4Neu for these D. pulex genotypes is 0.0204 (0.0005), whereas the average estimate of 4Nec is 0.00069 (0.00003), implying that on a per-site basis the mutation rate in this species is about thirty times the recombination rate. The estimated fraction of recombination events resolved as crossovers is x = 0.099 (0.020), and the average conversion tract length is . Daphnia is one of the few metazoan species in which conversion tracts can be directly observed by loss-of-heterozygosity in clonally propagated lines, and direct observations in this species (Omilian et al. 2007; Xu et al. 2011) are entirely consistent with these indirect estimates.
Second, to specifically investigate the variation in Δ profiles that can arise among individuals within a single population, we used the computer program ms (Hudson 2002) to generate independent diploid genotypes with the same input parameters (using the average values noted above for human sequences). As can be seen in Figure 7, when large numbers of sites are available per individual, the Δ profiles are very similar. Thus, there is little question that the variation observed among individuals in Figure 4 is a consequence of true variation in background parameters, and not a simple consequence of stochastic within-population variation.
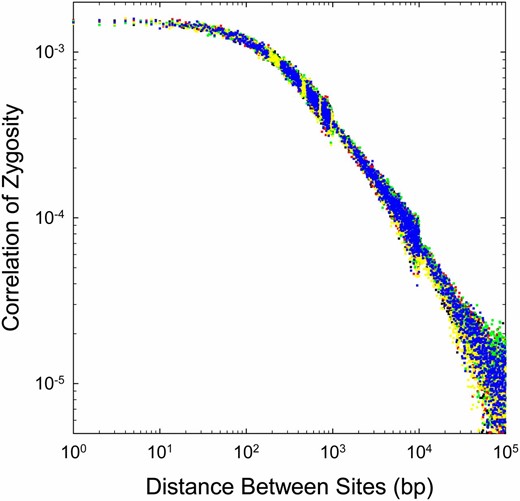
Replicate Δ profiles for five simulated human genomes (different colored points), each using the same mutation and recombination parameters (averages from the four observed genomes): ρ1 = 4Nec = 0.0062, x = 0.17, , and θ = 0.0016. Estimates beyond a distance of 1000 bp are pooled (bins of 10 bp for 1–10 kb, and bins of 100 bp for >10 kb). Discontinuities in the range of variation arise at 1 and 10 kb owing to this averaging and the fact that the sampling variance of LD increases with physical distance between sites. Each of the five sets of observations were generated by independent coalescents, with 10× coverage in the subsequently generated sequence, and Δ being estimated with the program mlRho.
Discussion
Although numerous techniques have been proposed for estimating LD from population samples (Stumpf and McVean 2003; Slatkin 2008), most applications of these methods have involved small to moderate numbers of nucleotide sites harboring alleles with intermediate frequencies. In addition, almost all attempts to estimate the population recombination rate ρ1 = 4Nec have assumed a standard neutral model with independently arising mutations, negligible gene conversion, and a linear relationship between the recombination rate and physical distance. The results presented above imply that all of these assumptions are violated in a wide range of species.
Rather than focusing on a large population sample with imprecise allele-frequency estimates, the approach presented here uses the information contained within the two chromosome sets of just a single diploid individual to estimate a function of LD that is directly related to the conventional population-level measure of LD, E(D2). Although estimation of the underlying recombinational parameters using this method does assume that the sampled individual is derived from a randomly mating population, the same assumption applies to extrapolations made with all prior LD methods involving multiple individuals.
Because a nonlinear regression involving four parameters has the capacity to yield a diversity of functions, an obvious question is whether the preceding empirical results are simply a curve-fitting procedure, as opposed to providing insights into the actual physical features of recombination. Several lines of evidence support the latter view. First, our conclusion that the fraction of recombination events resulting in crossing over (x) is generally on the order of 0.2 or less is quite consistent with previous observations. For example, x has been estimated to be in the range 0.25–0.34 in budding yeast Saccharomyces cerevisiae (Malkova et al. 2004; Mancera et al. 2008) and ∼ 0.14 in humans (Frisse et al. 2001; Padhukasahasram and Rannala 2013). The latter is not significantly different from our estimate of 0.17 for humans nor from our average estimate of 0.08 for other primates. For gene-sized regions in Drosophila melanogaster, Langley et al. (2000) concluded that almost all recombination is a consequence of conversion events, and using their data set, Yin et al. (2009) inferred x = 0.08, which is not greatly different than a direct empirical estimate of 0.15 in same species (Hilliker et al. 1994). From a high-resolution cross in Arabidopsis, Yang et al. (2012) inferred x ≃ 0.05, and population sampling yields estimates of x = 0.06 and 0.16 for barley and maize, respectively (Morrell et al. 2006).
Second, our conclusion that mean conversion-tract lengths are typically on the order of one to several kilobases is also consistent with previous observations. Estimates of are on the order of 400 bp in Eubacteria (Santoyo and Romero 2005), in the range 500–4000 bp in S. cerevisiae (Ahn and Livingston 1986; Judd and Petes 1988; McGill et al. 1990), and 400–1400 bp in D. melanogaster (Hilliker et al. 1994; Preston and Engels 1996; Miller et al. 2012). Paigen et al. (2008) have observed conversion-tract lengths in the mouse ranging from 200 to 1200 bp, and Padhukasahasram and Rannala (2013) have inferred tract lengths of 100–900 bp on human chromosomes. Other observations reviewed in Chen et al. (2007) and Rukść et al. (2008) suggest mammalian conversion-tract lengths in the range of a few hundred to two thousand base pairs. Finally, we note that a variety of mechanisms associated with double-strand-break repair, including break-induced replication and synthesis-dependent strand annealing, can lead to loss-of-heterozygosity tract lengths exceeding several thousands of base pairs (Omilian et al. 2007; Llorente et al. 2008; Xu et al. 2011). Such effects will have the same influence on LD as conventional meiotic gene conversions and almost certainly contribute to the mean tract-lengths inferred in our analyses.
Taken together, these observations strongly suggest that the vast majority of meiotic recombination events are resolved as simple gene conversions without crossing over, with average tract lengths of many hundreds to thousands of base pairs. Assuming an approximately geometric distribution of tract lengths (Ahn et al. 1988; Hilliker et al. 1994), which may underestimate the actual range of lengths, this means that conversion-like events up to tens of kilobases commonly occur. Thus, rates of recombination between sites separated by less than many thousand kilobases are generally much greater (up to 1/x greater) than one would expect based on a linear extrapolation from estimates of crossover frequencies derived from genetic maps.
Although future work with a much wider range of taxa will be required to determine whether the known cytological differences in meiosis (Kohl and Sekelsky 2013) translate into quantitatively significant differences in the features of recombination (e.g., x and ) among phylogenetic lineages, the consistency of our results with prior observations suggests a way forward. Aside from its applicability to the sequenced genomes of just single individuals, a substantial advantage of the proposed method is that it provides a genome-wide average view of recombinational features that is not dependent on the kinds of artificial constructs often deployed in laboratory experiments. In addition, analyses can readily be partitioned spatially to estimate regional features of chromosomes. Finally, because the method is agnostic with respect to allele frequencies, it provides a global estimate of LD that should be unaffected by biases that can arise when analyses are restricted to alleles that are able to rise to high frequencies, as has often been the focus of studies using .
While the mechanisms remain unclear, our observations of anomalous patterns of high LD at short distances are consistent with results from previous analyses in Drosophila (Andolfatto and Przeworski 2000), humans (Przeworski and Wall 2001), sorghum (Hamblin et al. 2005), and Arabidopsis (Kim et al. 2007), all of which suggest problems with the standard neutral model at short (typically intragenic) distances. The central issue is that the absolute amount of LD at distances <200 bp or so is far greater than expected under models that assume independent mutational and recombinational events.
There are at least three reasons why genetic events on such small spatial scales should not be treated as independent. First, as pointed out by Schrider et al. (2011), new mutations arise in a significantly clustered manner on spatial scales <100 bp or so. Such effects might result simply from an occasional defective polymerase engaging at origins of replication. Second, Hicks et al. (2010) find in S. cerevisiae an ∼800-fold increase in the mutation rate in newly synthesized strands involved in gene conversions, and more generally, double-strand-break repair appears to be mutagenic (Malkova and Haber 2012). Such effects not only contribute to mutation clustering, but also render mutation and recombination nonindependent events. Third, nonhomologous gene conversion can introduce excess LD at individual sites (Walsh 1988; Mansai and Innan 2010). Although we attempted to avoid the latter effects by restricting our analyses to sequence reads mapping to single sites, it remains possible that more divergent stretches of DNA occasionally engage in illegitimate conversion events.
One additional factor might contribute to anomalously high estimates of LD at very short distances—nonindependence of base-call errors at closely spaced sites. The likelihood functions employed in mlRho assume that errors at different sites arise independently, which seems entirely reasonable for distant sites contained in nonoverlapping sequence reads. However, it is possible that some individual reads will be subject to higher error rates throughout, causing an overestimate of LD on the spatial scale of individual reads. Localized mismapping might generate similar problems. Should they exist, such artifacts would be a concern for any method for estimating LD and are not unique to the method introduced herein.
Finally, we note that a number of studies have sought to exploit information on the relationship between population-level LD and physical distance to infer past population-size changes (e.g., Hayes et al. 2003; Tenesa et al. 2007; Qanbari et al. 2010). With an adherence to the assumption that the recombination rate between sites increases linearly with distance, i.e., rd = cd, the general idea underlying such studies is that the distance-scaled recombination parameter ρd/d (assumed to equal 4Nec) reflects population-size conditions ∼ 1/(2cd) generations in the past. A number of concerns with these methods have been raised (Corbin et al. 2012; Park 2012; MacLeod et al. 2013; Sheehan et al. 2013).
A related approach to inferring the history of population-size changes, which like our method uses sequence information from just single individuals, relies on inferences on the homozygosity tract-length distribution, i.e., the genome-wide distribution of distances between heterozygous sites (Li and Durbin 2011; Harris and Nielsen 2013). It has been argued that this method, which can also be extended to a sample of individuals (Sheehan et al. 2013), allows for the testing of specific demographic hypotheses, although again the assumption of a linear recombination rate–physical distance relationship is adhered to. A potential limitation of such analyses (not shared by the Δ estimator) is the issue of missing data, which break up homozygosity tracts (but simply reduce sample sizes used in Δ estimation).
Our observations raise significant questions about the use of both types of methods to infer the past demographic history of populations. A primary issue is that the relationship between LD and physical distance depends not just on past demographic changes but on the scaling features of recombination. With a nonlinear mapping of the recombination rate and physical distance apparently being typical up to at least 100 kb between sites, and the recombination rate per base pair being on the order of 10× greater for close than distant pairs of sites, it appears that any attempt to convert spatial patterns of LD to temporal patterns in Ne needs to employ some sort of nonlinear timescale transformation.
Without such correction, and adhering to a simple reliance on crossover-based genetic maps, biases in estimates of Ne of up to an order of magnitude may result. In effect, by simply extrapolating from crossover rates, the actual amount of recombination will be increasingly underestimated for more closely spaced sites. This will lead to overestimates in both the distance into the past that might be represented by such sites and the associated Ne, the exact pattern of bias depending on x and . We will leave to a future study an evaluation of the power of Δ profiles to infer past population history, but simply reemphasize that substantially different patterns of demographic change may also sometimes lead to quite similar distance-dependent patterns of LD (Figure 2). A similar point has been made previously with respect to interpretations based on the site-frequency spectrum of polymorphisms (Myers et al. 2008).
Acknowledgments
We thank A. Thota, S. Michael, and R. Henschel (University Information Technology Services, Indiana University) for computational assistance and M. Hahn for helpful comments. This work was support by National Science Foundation (NSF) grants EF-0827411 and DEB-1257806 and National Institutes of Health grant GM101672 to M.L. The computational analyses were supported in part by NSF grants CNS-0723054 and CNS-0521433, which support IU computational facilities. This work used the Extreme Science and Engineering Discovery Environment (XSEDE), which is supported by NSF grant OCI-1053575.
Footnotes
Supporting information is available online at http://www.genetics.org/lookup/suppl/doi:10.1534/genetics.114.166843/-/DC1.
Communicating editor: Y. S. Song
