


Abstract
Finding the genes underlying complex traits is difficult. We show that new sequencing technology combined with traditional genetic techniques can efficiently identify genetic regions underlying a complex and quantitative behavioral trait. As a proof of concept we used phenotype-based introgression to backcross loci that control innate food preference in Drosophila simulans into the genomic background of D. sechellia, which expresses the opposite preference. We successfully mapped D. simulans introgression regions in a small mapping population (30 flies) with whole-genome resequencing using light coverage (∼1×). We found six loci contributing to D. simulans food preference, one of which overlaps a previously discovered allele. This approach is applicable to many systems, does not rely on laborious marker development or genotyping, does not require existing high quality reference genomes, and needs only small mapping populations. Because introgression is used, researchers can scale mapping population size, replication, and number of backcross generations to their needs. Finally, in contrast to more widely used mapping techniques like F2 bulk-segregant analysis, our method produces near-isogenic lines that can be kept and reused indefinitely.
COMPLEX traits are inherently difficult to dissect genetically. Quantitative trait loci (QTL) studies, genome-wide association studies (GWAS), and forward and reverse genetics are all powerful tools; however, each technique has inherent weaknesses that limit ability to find causal loci (Mackay et al. 2009; Manolio et al. 2009). New methods using next-generation sequencing (NGS) technology have successfully captured single loci underlying Mendelian traits generated from mutagenesis screens (Sarin et al. 2008; Blumenstiel et al. 2009; Flibotte et al. 2010; Laitinen et al. 2010; Sarin et al. 2010; Xia et al. 2010; Zuryn et al. 2010); recombinant inbred lines (RILs) (Huang et al. 2009; Schneeberger et al. 2009); and backcross populations using dominant markers (Andolfatto et al. 2011). However, we lack a time- and cost-effective method that maps multiple loci simultaneously without a priori knowledge of their location, number, or effect size.
Mapping complex traits is more challenging than mapping Mendelian traits. QTL studies in the past decades have uncovered a plethora of loci underlying complex traits, but QTL methods lack the power to resolve candidate regions to individual genes (Mackay et al. 2009). New NGS approaches have the potential to capture multiple causative loci; however, these methods may also lack sufficient power. Huang et al. (2009) proposed “whole-genome resequencing” (WGR), and Baird et al. (2008) proposed “restriction site associated DNA” (RAD) genotyping, which both use NGS-based mapping on bulk segregant populations (Michelmore et al. 1991). These methods require large mapping populations to detect multiple loci of weak effect (e.g.,Ehrenreich et al. 2010). Andolfatto et al. (2011) developed a “multiplex shotgun genotyping” (MSG) method, yet MSG also relies on large backcross populations, and it is not clear if their approach can track quantitative or additive loci of relatively weak effect or if closely linked loci can be isolated.
We have developed a new approach that efficiently maps multiple loci contributing to a complex trait. Our method uses phenotype-based selection and introgression followed by whole-genome resequencing (PSIseq). Our method can be easily scaled from rough mapping of a single small population to fine-scale mapping of large and replicated populations. With minimal replication, low cost, and few genomic resources, we can map any complex trait divergent between any two interfertile populations. This approach takes advantage of the statistical power of window-based mapping algorithms on NGS data (Huang et al. 2009) and the ease of using relatively small mapping populations. Because introgression is used instead of F2 bulk segregant analysis, mapping populations can be treated as near isogenic lines and be reused indefinitely.
Materials and Methods
Overview
Populations with a divergent complex trait are hybridized and then selected for a specific phenotype across multiple generations of backcrosses. Our proof of concept uses a species-level phenotype, but this method can work on any two interfertile populations. The trait of interest is selected for each generation, and offspring are mated to the other parental line expressing the unselected phenotype (introgression and backcrossing). Over multiple generations of selection and backcrossing this hybrid population becomes homozygous for the majority of the unselected parent’s genome while loci from the selected parent, which contribute to the selected trait, remain. Using high-throughput sequencing, we map the breakpoints of these introgressions and, therefore, map the regions harboring genes influencing the trait. This scheme is analogous to introgression-based mapping approaches that use marked transposable elements or molecular markers (True et al. 1996; Laurie et al. 1997; Desjardins et al. 2010). A recessive trait may also be introgressed, although this would require an extra inbreeding step following each backcross.
Phenotype-based selection and introgression
We tested our method on a putative complex behavioral trait divergent between two Drosophila sister species: D. simulans (c167.4) and D. sechellia (SynA). D. sechellia is an island-endemic and phytophagous specialist that prefers the smell and taste of Morinda citrifolia (Morinda) fruit (Jones 2005; Matsuo et al. 2007; R'Kha et al. 1991). D. simulans avoids the fruit and dies when in proximity to it and its constituent organic acids (Jones 1998; R'Kha et al. 1991). As a proof of concept, we introgressed D. simulans Morinda aversion behavior into the D. sechellia genome over 15 generations of backcrossing and selection. For systems with longer generation times where 10+ generations of backcrossing is not a viable option, one can easily reduce the number of backcross generations (e.g., one to five) while increasing introgression replication (see Results and Figure 2 for a discussion of how to balance replication size vs. backcross generation number).
Virgin D. simulans females were mated to D. sechellia males to create a large population of fertile F1 females. These hybrids express D. simulans behavior and were backcrossed to D. sechellia males. Roughly 30 F2 females were subjected to our behavioral assay, and individuals displaying D. simulans behavior were collected and backcrossed to D. sechellia males. The assay is identical to that described in Dworkin and Jones (2009). Briefly, octanoic (45 μl) and hexanoic (15 μl) acids were added to instant Drosophila media (4.1 g + 22 ml diH20, Carolina Biological Supply), or not, to create test and control food, respectively. Flies had 48 hr to choose a medium. Flies settled on control media were considered D. simulans phenotype. This cycle—an assay of ∼30 females then backcrossing—continued for 15 generations. The final generation was inbred for 2–3 generations to ensure that introgressed loci were mostly in a homozygous state. Thirty females were pooled for Illumina library preparation.
Introgression mapping
To map introgression breakpoints, we used reference genomes of these species to identify single-nucleotide species differences (analogous to SNPs) that identify genomic regions as particular to a parental genome. While our proof of concept used the relative high-quality Drosophila genomic assemblies, nonmodel systems without a finished assembly can still be used. In principle, a sequenced transcriptome or a rough de novo assembly, for example, can be used to capture introgression blocks (or transcripts), as well.
We found on average one SNP per 100 bp (1% divergence, compared to the reported 2% from Kliman et al. 2000). Because these SNPs represented genetic changes between these species, markers may have also contributed to phenotypic divergence. To create our species-specific SNP map, we aligned the D. simulans and D. sechellia reference genome sequences (r1.3) reciprocally using BWA (Li and Durbin 2009). Small insertion–deletion (indels) and microsatellites could also be used, although we did not use them in this study. We also showed that the genome of D. melanogaster can be used as a proxy for a reference genome and showed that SNPs distinguishing D. simulans and D. sechellia could be identified by aligning short sequencing reads from these species to the D. melanogaster reference using a high mismatch tolerance in the alignment (data not shown). In nonmodel systems this could be particularly beneficial. If neither parental line possessed an assembled genome or transcriptome, a closely related model-system assembly could be used.
Individual flies from this 15th generation introgression (BC15) lineage were pooled and sequenced en masse using one lane of Illumina Genome Analyzer 1.0. Sequences were deposited in the NCBI Short Read Archive (SRA) database (SRA039418.2). High quality reads were aligned via BWA to both D. sechellia and D. simulans reference genomes (84 and 72% mapped, respectively). A mismatch call required at least two confirming reads. Hybrid–parent mismatches were correlated to our parent–parent SNP database. All hybrid–parent mismatches also present in the parent–parent SNP database were considered true hybrid–parent SNPs. Despite quality filtering hybrid–parent SNPs through these two processes (multiple confirming reads and existence of parent–parent SNP), we could not be sure if a given SNP call was accurate due to sequencing and mapping errors. To overcome this, we mapped introgression breakpoints using a window approach (as described in Huang et al. 2009). Any individual miscalled SNP had minimal effect on our search for large-scale SNP enrichment. Every 1000 parent–parent SNP was considered a “bin,” and we counted the number of hybrid–parent SNPs within this bin. Our null expectation was that hybrid–parent SNPs were binomially distributed within each bin. Any bin that harbored a significant enrichment of D. simulans SNPs over the chromosomal mean D. simulans SNP content was considered an introgression block member (Student’s t-test). This window approach required multiple independent significance tests, which we corrected for via a false discovery rate (FDR) calculation.
Confirmation of X chromosome effect
D. sechellia males with recessive genetic markers evenly spaced along the X chromosome—zn (1-25) and f (1-56)—were mated to D. simulans females. The resulting F1 females were backcrossed to males from the D. sechellia parent. Thus, we can distinguish D. sechellia X chromosomes from D. simulans X chromosomes. We compared the influence these two classes of chromosomes have on adult food preference using a single fly two-choice oviposition assay (Matsuo et al. 2007). Prior work has shown that bulk population assays produce similar results to individual fly assays (Amlou et al. 1998; Matsuo et al. 2007). The single fly assay was simpler for genotyping and it was different than the selection assay, yet assayed a similar phenotype. Each female was allowed to oviposit for 2 days in a chamber containing control or test media (above). Preference was determined by which medium received the most eggs. All assays were conducted at 20° with relative humidity 50–70%.
Results
In our proof-of-concept study in which D. simulans preference loci were introgressed into the D. sechellia genome over 15 generations within one lineage, we found that our hybrids chose non-Morinda medium 71% of the time, comparable to D. simulans behavior (94%), and in contrast to D. sechellia (18%). We found six bins showing significant D. simulans identity (Figure 1; P < 0.0002). Two of these bins were relatively large (1–1.5 Mb), whereas four others were smaller (20–200 kb). Three independent introgression loci on chromosome arm 2L were found within a 7-Mb region, illustrating the power of our method in resolving closely linked loci. We pinpointed a small region on 2R that contains a gene for Odorant Binding Protein 56e previously shown to weakly affect preference (Dworkin and Jones 2009). Combined, these six loci account for 75% of D. simulans aversive behavior. Our bins harbored genes underlying diverse traits: fatty-acid metabolism (bubblegum), cuticle tanning (rickets), vision-directed behavior (black), insecticide response (nAcRα-30D), temperature-directed behavior (pickpocket), antennal development (elbow B), and olfaction-directed behavior (Smi35a). (A complete list is in supporting information.)
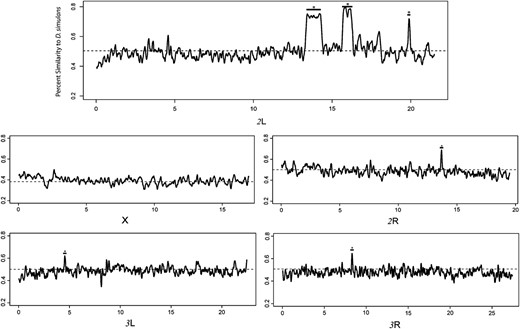
Fifteen generations of introgression show D. simulans enrichment for six regions across autosomes. Percentage similarity to D. simulans was calculated via comparing hybrid SNPs to all possible species-level SNPs within a bin (1000 SNPs, overlapping, sliding). If all hybrid SNPs correspond to all possible D. simulans SNPs, the percentage similarity is 1. If the opposite is true, all hybrid SNPs correspond to D. sechellia SNPs, and the percentage similarity is 0. Regions showing significant enrichment for D. simulans SNPs are marked (*, P < 0.0002 or within-arm-FDR-correction). We estimate that these factors explain approximately 75% of D. simulans aversion behavior. Three loci were found clustered within a 7-Mb region on 2L (1, 0.5, and 0.3 Mb, moving from telomere, left).
To confirm that our method was accurately enriching for regions affecting our complex trait, we used three approaches. First, we used an introgression model to give us expected sizes of introgression blocks given recombination rate, number of backcross generations, and the level of replication (Figure 2). Second, we created a backcross simulation to estimate the size and frequency of nonbackcross parental blocks remaining after 15 generations of backcrossing without selection—that is, how often we would expect to see introgression blocks by chance alone. Finally, to ensure that D. simulans enrichment was not simply an artifact of bin size, we rebinned chromosomes at fewer (500) and greater (10,000) SNPs per bin (Figures 3 and 4).
Introgression modeling
To confirm that our method mapped regions of an appropriate size, we created a forward simulation to estimate the mean and variance of donor introgression block sizes (Figure 2). Our model uses recombination rates from Drosophila (True et al. 1996) within the recombination model of Foss et al. (1993), which incorporates crossover interference. We assumed a D. simulans genetic map of 460 cM and relatively simple interference (a noncrossover event must occur between adjacent crossovers, m = 1 from Foss et al. 1993). Over multiple backcross generations, an introgressed block size decreases asymptotically to 0 cM. With multiple independent introgressed replicates, the variance in block size also decreases asymptotically to 0. In our case, one replicate over 15 generations is expected to have a block size of ∼5 ± 5 cM. Our experimentally observed blocks were ∼0.5–1 cM, falling well within the expected block size. In Drosophila, 1 cM is roughly equivalent to 0.5 Mb, depending on chromosomal position.
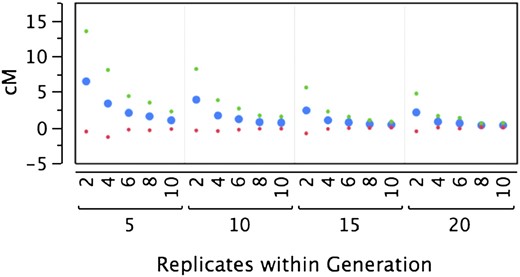
Mean size of candidate chromosomal region. Shown are results from a forward model estimating the size of introgressed blocks in a backcross with selection scenario. The block, x, is the chromosomal region uniquely overlapped by all introgression lines, L. The size of x will depend on the number of generations of introgression and the number of independent lines (Replicates). We simulated this process for 2–10 replicate lines and 5–20 generations. The average x is blue; green and red dots represent 1 SD above and below the average, respectively.
Backcross simulation
D. simulans-enriched regions could also remain due to drift alone. To reveal the variation of introgression size by chance (that is, without selection), we performed a simulation of introgression with backcrossing. We populated a virtual pool of chromosomes made up of two parental genotypes, A and B. Each generation, an A chromosome was recombined with a B chromosome, experiencing one crossover event at a random position. Each event created two daughter chromosomes that received reciprocal products. To maintain a stable population size, one daughter from each crossover was picked at random to propagate the next generation. This daughter was then “backcrossed” to a B chromosome. This cycle—recombination to B (the “backcross”) followed by randomly choosing daughter recombinants (“drift”)—was repeated 15 times with two levels of replication (2000 and 20,000; see below). We tracked the size of A chromosome blocks maintained at each generation and calculated the population-wide A allele content after 15 generations.
In infinitely large populations, theory predicts that, on average, half of the A alleles will remain after each cycle of recombination and drift. In noninfinite populations, however, drift will likely remove more than half of A alleles. This is because once an A allele is lost, it is lost forever, and the probability of A alleles being lost due to drift is additive across generations. To get a sense of allele loss due to drift, consider an infinite population experiencing recombination and drift over 15 generations. This should produce a frequency of A alleles equal to (1/2)15, or 3.05 × 10⁻⁵% of the population allele frequency. In our simulation of 2000 independent backcross lineages we found only one surviving A block within one chromosome for a population frequency of 3.8 × 10⁻⁹% (152 bp in one 20-Mb chromosome).
Disregarding the low probability (1 in 2000) of introgression by chance alone, we measured the variation in A frequency under a selection-free scenario. Simulations were repeated until 14 independent A blocks were found (20,600 replicates). Conditioning on an A block persisting (N = 14), sizes ranged from 0.7 to 27% of one chromosome (avg = 6.1 ± 7.4%). At a population level (N = 20,600), sizes ranged from 3.4 × 10⁻⁷% to 1.3 × 10⁻⁵%. In our pilot experiment, we introgressed one lineage with selection and found at least 6 blocks ranging in size from 20 Kb to 1.5 Mb (0.1–7.5% of a 20-Mb chromosome). Our simulation script is available within the PSIseq manual (supporting information).
Binning effect
In our effort to find regions of the 15th generation hybrid genome enriched for D. simulans, we binned chromosomes into overlapping 1000 SNP (∼100 kb) sections. This size was chosen primarily with consideration of Drosophila genic density. However, choice of bin size influences one’s ability to detect significant SNP enrichment. For example, picking a large bin size will mask enriched regions by including adjacent nonenriched regions. A bin size that is too small will force many comparisons and the corrected α threshold will be too low. Ultimately, bin size determines one’s ability to detect enrichment.
To illustrate the influence of binning on our analysis, we rebinned generation 15 chromosome arms 2L and 2R at different sizes. Starting with a bin size of 500 SNPs (∼50 kb) we tracked clustering of D. simulans SNPs, calculated P-values, and then repeated this process, increasing bin size to a maximum size of 10,000 SNPs/bin. All bins overlap by 10% of their bin size. Because bin size scales inversely with the number of bins (hence the number of significance tests), the threshold of significance according to a FDR changes.
Figure 3 and Figure 4 show data from chromosome arms 2L and 2R, respectively, produced by four sample bin sizes. The two large regions on 2L showing significant D. simulans SNP enrichment maintained this significance under all bin sizes. As expected, regions are not identified as significant for all bin sizes. As arm 2R (Figure 4) shows that, while regions harboring sharp peaks in D. simulans enrichment stand out, large regions with relatively shallow enrichment can still approach significance (e.g., centromeric region of 2R). One’s ability to detect significance at a given bin size is influenced by the physical size of the introgression block and the magnitude of SNP enrichment; thus it is difficult to predict what is the “right” bin size. When choosing a bin size it is more important to consider the biological and experimental conditions: recombination rate, generation number, gene density, influence of recombination hotspots, etc.
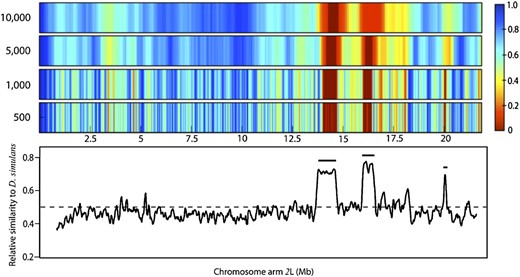
Ability to detect D. simulans enrichment with dynamic binning. Shown are sections from a heat plot of P-values on chromosome arm 2L from generation 15 hybrids, the same region shown in Figure 1. Four bin sizes were chosen to illustrate the binning effect described above: 500, 1000, 5000, and 10,000 SNPs/bin moving from middle to top. Heat plot colors correspond to corrected P-values (normal approximation of binomial; significance set by FDR); dark red regions have met the FDR threshold and are considered significantly enriched for D. simulans. The color gradient from light red to dark blue corresponds to scaled P-values, which are not significant. Bottom shows reproduction of Figure 1 for reference. Horizontal positions in the heat plots correspond to physical location on bottom.
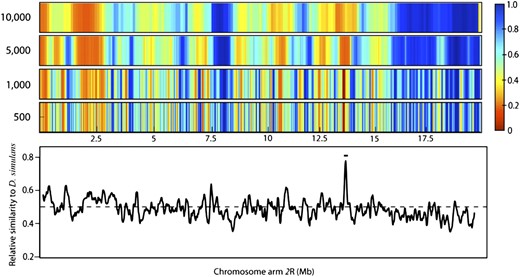
Identical to Figure 3, but for chromosome arm 2R. The single peak on this chromosome encompasses Obp56e, which is known to affect aversion behavior.
Independent confirmation of the effect of the X chromosomes
The X chromosome appeared not to harbor any genes affecting aversion behavior. An alternate explanation for this pattern is that our single introgression did not capture all regions affecting aversion. (As noted above, we captured only about three-quarters of the D. simulans phenotype with this single introgression line.) This will most likely occur within chromosomes where local recombination landscape can affect the efficacy of selection. We did not expect this problem within an independent linkage group.
Backcrossed D. simulans/D. sechellia flies with X-linked markers were subjected to an oviposition assay. When controlling for the influence of the X chromosome, we confirmed the absence of its effect. Of the 169 flies with D. sechellia X, 77% avoided the Morinda medium. Of the 202 flies with D. simulans X, 73% avoided the Morinda medium. This pattern goes in the opposite direction predicted and is not statistically significant (χ2 = 0.642, d.f. = 1, P = 0.4229).
Discussion
We have shown that PSIseq can efficiently map the genetic basis of a complex trait. This method can find multiple loci with small mapping populations that remain usable beyond mapping experiments. Other NGS methods rely on transient F2 mapping populations, which are irrevocably lost once nucleic acids are extracted. On the other hand, introgression stocks can be tested in future assays to further resolve candidate regions. Only low sequencing coverage is needed for rough mapping, and replicate populations can be created over time. We found at least six loci contributing to D. simulans aversion of Morinda compounds, and we confirmed the influence on behavior of an odorant binding protein locus discovered previously (Obp56e; Dworkin and Jones 2009).
NGS mapping is typically composed of three main steps: (1) create a mapping population, (2) extract DNA and prepare libraries, and (3) assemble short reads and genotype. PSIseq improves the first and third steps. First, PSIseq uses introgression lines propagated for more generations instead of an F2 backcross line because this allows mapping of smaller candidate regions. Closely linked loci can be decoupled and mapped separately, especially if multiple replicate introgressions are made. For example, Baird et al. (2008), Sarin et al. (2008), Blumenstiel et al. (2009), Huang et al. (2009), Schneeberger et al. (2009), Zuryn et al. (2010), and Andolfatto et al. (2011) all used F2 backcross populations and successfully mapped single loci from mutagenesis screens or dominant marker mapping. PSIseq was able to isolate at least six distinct loci in our pilot study, three of which occurred within a 7-Mb region (See Figure 1).
PSIseq also improves the third step in NGS mapping: genotyping. Instead of using only common SNPs (à la GWAS), PSIseq uses all possible SNPs and avoids potential bias in mapping to particular regions. A major issue with current short-read technology is the high per-base sequencing and mapping error rates. PSIseq overcomes this by using a window-based mapping approach, as described by Huang et al. (2009). A group of SNPs are collected into bins (“windows”), and statistical tests are performed on these bins. Thus, while a small percentage of SNPs may be inaccurate, these false SNPs are engulfed by surrounding populations of true SNPs. This method works particularly well when mapped regions are fixed for one parent and contain few polymorphisms (e.g., RILs) and for rough mapping of hybrid genomes sequenced lightly. As an alternative to the window approach, Andolfatto et al. (2011) developed a customized hidden-Markov model (HMM) to assign the probability of a SNP’s ancestry. The power of this method lies in its ability to map with high resolution the boundaries surrounding the recombination breakpoint itself. We take a more simplistic approach in identifying ancestry by measuring SNP enrichment under a binomial expectation.
PSIseq has additional advantages. First, the experimental replication needed to increase mapping resolution can be spaced out over time, and population sizes within a replicate need only be large enough to maintain the introgression line—as small as one lineage per replicate. This approach allows us to increase introgression replicate sizes and the quality and number of phenotypic measurements. Second, like sequenced RILS (Huang et al. 2009), these selected introgression lines are potentially shelf stable and can be used in future experiments. Third, complex traits can be mapped in organisms lacking a high-quality genome assembly. For example, with transcriptome sequence from parental and introgression lines one could identify gene transcripts enriched for alleles from the selected parent. Finally, in addition to being flexible and extensible, our approach needs only low sequence coverage (∼1×) for rough mapping, given enough SNPs (e.g., ∼100-kb resolution). To increase resolution of candidate regions one could replicate introgression crosses (see Figure 2) or take advantage of new targeted enrichment sequencing (Antson et al. 2000; Albert et al. 2007) to increase coverage for only interesting regions. This strategy would be particularly useful for regions with repetitive elements, duplications, pseudogenes, and other elements difficult to align at lower coverage.
Our study measured a divergent trait between two species, but our approach can be applied to two genetically diverged individuals. The parental line would be sequenced, unique SNPs identified, and then introgression and selection performed. Typically, these strains would have a lower SNP density. We provide a simple model for estimating the expected mapping resolution for a trait given sequence divergence rate and bin size (supporting information). For example, populations with relatively low sequence divergence (0.1%) and bins of 1000 SNPs each could be mapped to 2-Mb regions within one replicate introgression lineage, depending on recombination rates, strength of phenotypic selection during introgression, and mapping quality.
Acknowledgements
We thank Diana Hall for suggesting the Bionomial test, Sophia Shih and Piotr Mieczkowski for technical assistance, and Lauren McIntyre, J. Reinhardt, and A. Romanchuk for comments and suggestions. We also thank the anonymous reviewers for their comments. This work was supported the University of North Carolina University Cancer Research Fund, and National Science Foundation—Graduate Research Fellowship Program (E.J.E.).
Footnotes
Communicating Editor: K. M. Nichols
Literature Cited
Author notes
Supporting information is available online at http://www.genetics.org/content/suppl/2011/09/21/genetics.111.129445.DC1.
