


Abstract
Dynamic species' ranges, those that are either invasive or shifting in response to environmental change, are the focus of much recent interest in ecology, evolution, and genetics. Understanding how range expansions can shape evolutionary trajectories requires the consideration of nonneutral variability and genetic architecture, yet the majority of empirical and theoretical work to date has explored patterns of neutral variability. Here we use forward computer simulations of population growth, dispersal, and mutation to explore how range-shifting dynamics can influence evolution on rugged fitness landscapes. We employ a two-locus model, incorporating sign epistasis, and find that there is an increased likelihood of fitness peak shifts during a period of range expansion. Maladapted valley genotypes can accumulate at an expanding range front through a phenomenon called mutation surfing, which increases the likelihood that a mutation leading to a higher peak will occur. Our results indicate that most peak shifts occur close to the expanding front. We also demonstrate that periods of range shifting are especially important for peak shifting in species with narrow geographic distributions. Our results imply that trajectories on rugged fitness landscapes can be modified substantially when ranges are dynamic.
SEWALL Wright argued in the 1930s (Wright 1931) that organisms should be considered to exist on an “adaptive landscape” where an individual's fitness on that landscape is determined by genetic and environmental factors. He envisaged potentially complex landscapes with multiple fitness peaks separated from one another by adaptive valleys and questioned whether populations can evolve from one peak to a higher one when doing so involves crossing maladaptive valleys. Wright's shifting balance theory of evolution suggested that peak shifting can occur by genetic drift if population sizes are, at least periodically, small enough (Wright 1931; Moore and Tonsor 1994). These early ideas have been the subject of considerable debate within evolutionary biology. There has been a question mark over whether fitness landscapes really do have peaks and valleys (Whitlocket al. 1995; Lunzeret al. 2005; Weinreichet al. 2005) and recent theory has suggested that peak shifting can occur even in very large populations, albeit by a different mechanism (Weinreich and Chao 2005).
There is an emerging consensus that real fitness landscapes are complex and that peak shifts can play an important role in shaping evolutionary trajectories (Devisser and Hoekstra 1998; Wolfet al. 2000; Burchet al. 2003; Sanjúan and Elena 2006; Beerenwinkelet al. 2007). Genetic loci frequently exhibit interactions where the fitness effect of a mutation at one locus is dependent upon the genetic background determined by other loci. These interactions between loci, termed epistasis, play an important role in determining the characteristics of a fitness landscape, and one particular form of genetic interaction, termed sign epistasis (Weinreichet al. 2005), can readily lead to peaks and valleys. Sign epistasis occurs when a single mutation has a beneficial fitness effect on one genetic background but a deleterious effect on another (Weinreichet al. 2005). There is rapidly accumulating empirical evidence to support the idea that the sign, as well as the magnitude, of a mutation's fitness effect can depend upon the genetic background (Lehminget al. 1990; Orgogozoet al. 2006; Weinreichet al. 2006; Poelwijket al. 2007). To date, most of the evidence for sign epistasis comes from microbes, and it has been shown to be potentially important in shaping evolutionary trajectories that lead to the acquisition of drug resistance (Lehminget al. 1990; Weinreichet al. 2006; Poelwijket al. 2007). The application of quantitative trait loci methods has also demonstrated the importance of sign epistasis in eukaryotic systems (Orgogozoet al. 2006) and technological advances will continue to further our understanding of the genetic control of fitness landscapes.
In this article we are interested in extending recent theory on fitness peak shifting (Wade and Goodnight 1998; Carteret al. 2005; Weinreich and Chao 2005; Weinreichet al. 2005; Jain and Krug 2007; Kim 2007) to ask how the course of evolution on rugged fitness landscapes is likely to differ depending upon whether a population's geographic range is stationary or dynamic. Disease epidemics, species invasions, and the shifting of geographic ranges in response to environmental change all represent important applied biological issues involving nonstationary ranges. Evolution can shape the spatial population dynamics of range expansions (Thomaset al. 2001; Travis and Dytham 2002; Lambrinos 2004) and, in turn, the spatial population dynamics of range expansions can modify evolutionary processes (Travis and Dytham 2002; Holt 2003). It has also recently been proposed that the evolution of modern humans may have arisen due to a novel genotype occurring, and spreading, on the wavefront of an expanding population (Eswaran 2002; Eswaranet al. 2005).
Recent work demonstrates that neutral (Edmondset al. 2004; Klopfsteinet al. 2006; Hallatscheket al. 2007; Hallatschek and Nelson 2008) and nonneutral mutations (Traviset al. 2007) arising on the edge of a range expansion sometimes “surf” on the wave of advance and can thus reach a larger spatial distribution and higher frequency than would be expected in a stationary population. Demes toward the front of an expanding range are frequently below carrying capacity and therefore individuals, regardless of their genotype, that occur close to this area are exposed to reduced density dependence. The offspring of these individuals may then experience reduced intraspecific competition as they are more likely to become the initial colonizers of patches beyond the existing front (Edmondset al. 2004; Klopfsteinet al. 2006; Traviset al. 2007). Thus, even mutants of substantially lower fitness can surf on the wavefront of an expanding population (Traviset al. 2007).
Here we use individual-based simulations, derived from a previously described two-locus haploid system (Weinreich and Chao 2005), to explore how the surfing dynamics recently described for single-locus systems (Edmondset al. 2004; Klopfsteinet al. 2006; Traviset al. 2007) might influence the rate of fitness peak shifting in populations expanding their range. We model a simple two-locus haploid system consisting of an A locus (with alleles a and A) and a B locus (with alleles b and B). ab genotypes have intermediate fitness, Ab and aB genotypes have the lowest fitness, and AB genotypes have the highest fitness. We run two sets of scenarios: the first assumes a stationary range and limits the population to the first 50 columns for the duration of the simulation, while the second allows the population to expand its range across the lattice.
MATERIALS AND METHODS
The individual-based simulations:
We use an individual-based spatial simulation model to investigate the genetic dynamics of two biallelic loci in both stationary and range-shifting populations. This model extends recent studies (Edmondset al. 2004; Klopfsteinet al. 2006; Traviset al. 2007) investigating mutations arising at expanding range margins in two important directions: first, it investigates nonneutral mutations and considers interactions between a pair of loci, and second, it incorporates a rate of mutation rather than following the fate of a single mutation that arises at a specified time and point in space. Our model assumes that sign epistasis generates a fitness landscape with a suboptimal peak (ab), a valley (Ab or aB), and a global peak (AB) (see Figure 1).
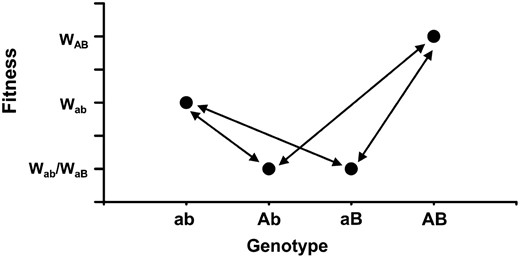
Sign epistasis as incorporated in the model. Fitnesses of each of the four possible genotypes for a pair of biallelic loci. Arrows illustrate mutational pathways. Genotype ab represents a local fitness peak, AB is the global optimum, and aB and Ab represent fitness troughs.
Spatial population dynamics:
The environment is represented as a rectangular two-dimensional stepping-stone grid with absorbing boundaries. Unless otherwise specified all results are for a grid with 300 columns and 50 rows. The model is initialized by populating all the patches in the first z columns with individuals, where z specifies the width of the population's range. The width of a population's range refers to how many columns it occupies and is thus a measure of distance perpendicular to the range front. In each generation every individual produces n offspring, where n is drawn at random from the Poisson distribution with mean R. Each offspring emigrates with probability d (in all simulations presented here d = 0.10). Dispersing individuals move with equal likelihood to any one of the four neighboring patches. Absorbing boundaries are assumed such that individuals dispersing beyond the limits of the lattice die. Juvenile competition follows natal dispersal. All the juveniles in a patch survive to the next generation if their numbers do not exceed K. If K is exceeded, then only K survive competition and the composition of genotypes surviving to the next generation is drawn at random from Wallenius' noncentral hypergeometric distribution (Traviset al. 2007). The parameters used to draw randomly from this distribution are the number of each genotype among the juveniles, the total number of juveniles, the number of adults within the next generation (K), and the fitness of each genotype (see Genetics and selection). When the model is used to simulate stationary populations the first z columns of the lattice are occupied for the entire simulation while the rest of the lattice is assumed to be unsuitable. In simulations of moving ranges we run the model exactly as for a stationary range but the whole lattice is made available for colonization so the population immediately begins to move to the right. To control for range width, and prevent a continually increasing total population size, we remove all individuals that are sited >z columns from the rightmost occupied patch. This results in a moving range that is a constant z columns wide.
Genetics and selection:
We model haploid individuals and assume a simple genetic system comprising two biallelic loci. We incorporate sign epistasis (see Figure 1) such that genotype ab (wild type) has intermediate fitness, genotypes Ab and aB (single mutants) have the lowest fitness, and genotype AB (double mutant) has the highest fitness. Initially all the individuals in the population have genotype ab. Mutations to either locus occur at random at rate μ. Here the fitness of each genotype, and therefore the relative competitive ability of each individual, is set as 1.0 for wild types, 3.0 for the double mutants, and the single mutants have fitness values that are varied for different simulations. In this article we are interested in how frequently double mutants occur, and we refer to the occurrence of a double mutant as a peak shift. This relates to phase I of Wright's shifting balance theory whereas other studies have focused on the subsequent spread of a double mutant through a population (e.g., Peck and Welch 2004).
Simulation experiments and data collection:
A first set of simulations are conducted for range-shifting populations where data are collected on population size and frequency of single mutants relative to the range front. Additionally we collect data on the position relative to the range front where double mutants first arise. The model is run 1000 times until either a double mutant arises or t = 1200. These simulations take place on a lattice 800 columns wide.
A second set of simulations is designed to investigate the effect of the fitness of single mutants on the frequency of occurrence of double mutants. The fitness of the single mutant is varied from 0.05 to 1.0 in increments of 0.05. These simulations are conducted using mutation rates of 10−4 and 10−5 keeping all other factors constant. Here set values of K = 10 and R = 1.8 are used in every case. In this set of simulations the model is always run for exactly 800 time steps and a single simulation is defined as successful when at least one double mutant is present within the population at t = 800 (the end of a model run). Additionally, we run simulations that are modified so that instead of establishing the proportion of times that double mutants are present at the end of simulation (t = 800), we record the time taken for the first double mutant to arise. In many cases it takes far longer than 800 time steps for this to occur. For example, mean time to peak shift occurrence (waiting times) can be >100,000 time steps (see results for further examples). We collect waiting times for mutation rates of 10−4, 10−5, and 10−6 for both stationary and moving ranges.
In a third set of simulations we repeat the method outlined above but now investigate the effect of geographic range by varying z (the parameter controlling the distance behind the range front from where populations are removed). Again, in this set of simulations we use K = 10 and R = 1.8.
The influence of dispersal probability on the outcome is established by running simulations where emigration probability is varied from 0.05 to 0.50 in increments of 0.05, keeping all other parameters constant. The second, third, and fourth sets of simulations are all carried out for both stationary and range-shifting populations.
Finally, we run simulations for both a stationary and a shifting range where we track the fate of mutations once the first double mutant has arisen. In these simulations as soon as a double mutant arises we reduce the mutation rate to zero, and for a further 100 generations we collect data that allow us to estimate the extinction probability and mean population abundance of the double mutants.
The model is implemented in C++ and code is available on request.
RESULTS
Observations of the model indicate that fitness peak shifts can occur via two routes during range expansions (Figure 2). Single mutants (aB or Ab) frequently reach high density and sometimes considerable spatial extent at the front of an expanding range. In many cases the peak shift to a double mutant (AB) occurs within these single mutant “surfers” at the range front (Figure 2, A and B). Sometimes double mutants arise that are not associated with these surfing dynamics, and in some cases this is due to simultaneous mutations at both loci within the same individual (the mechanism responsible for the peak shift observed at t = 340 in Figure 2B).
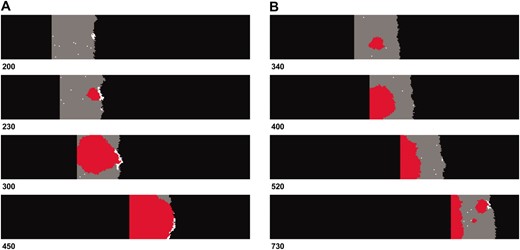
Snapshots of two independent simulations illustrating the typical dynamics observed. Unoccupied habitat is shown in black. Gray areas depict demes containing wild-type individuals and white and red for single and double mutants, respectively. (A) An instance where single mutations surf at the edge of the range and a double mutant arises within this population. This genotype then propagates through the shifting range. (B) An example where both single mutations occur simultaneously within a single individual toward the middle of the range; additionally a second double mutant later arises following a single mutant surfing event. The number of generations that has occurred is shown for each snapshot. Parameters used were K = 10, R = 1.8, d = 0.1, WAb/aB = 0.2, and WAB = 3.0.
Population and genetic dynamics across the moving range are explored further by considering how the total population size and proportion of single mutants are dependent on distance from the front of an expanding population (Figure 3A). Total population size is smaller at the front but a higher proportion of these individuals are single mutants compared to elsewhere in the range. These two trends together determine the spatial pattern of single mutant abundance and we observe the greatest number of Ab and aB individuals a short distance behind the front (Figure 3B). It is at this distance from the front that double mutants most frequently arise (Figure 3B). In an equivalent set of simulations, modified only so that mutations cannot occur simultaneously at both loci within the same individual, an even greater relative frequency of double mutants originates at the front compared to the rest of the range (Figure 3B).
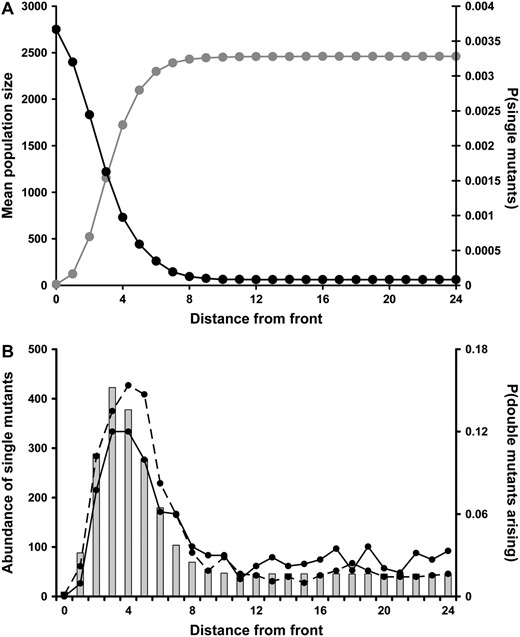
The spatial pattern of single and double mutants. (A) The total population size (shaded) and proportion of individuals that are single mutants (solid) with respect to the expanding range front. Both of these are means taken from 20 independent runs of the model. (B) The abundance of single mutants (shaded bars) and the relative frequency with which double mutants arise (solid line) in relation to the front. Additionally, we show the relative frequency with which double mutants arise when it is not possible for both mutations to occur simultaneously. These results are means from 1000 runs of the model. In each run, the model continued either until a double mutant occurred or to t = 1000. The position of the front is defined by the deme with the highest x coordinate. Parameters used were K = 10, R = 1.8, d = 0.1, WAb/aB = 0.2, and WAB = 3.0.
The effects of the fitness of single mutants on the occurrence of double mutants within stationary and moving ranges are substantial. We compare the proportion of simulations in which AB genotypes are present at the end of simulations. As the fitness trough becomes shallower (as WAb and WaB approach 1.0) AB individuals are found at the end of a greater proportion of simulations (Figure 4, A and B). The shape of the relationship between the number of successful simulations and the fitness of the single mutants differed between the two mutation rates (compare Figure 4A with 4C). In almost all cases AB individuals are present more often at the end of simulations involving dynamic ranges compared to stationary ranges. The only exception to this trend is for the lower mutation rate (μ = 10−5) when the fitness trough is very shallow. (Figure 4D: WaB > 0.95). Here more successful simulations are observed for stationary ranges than their dynamic equivalents. Range shifting appears to have the greatest effect on peak shifting, for both mutation rates, when the fitness trough is deepest and the highest relative increase in peak shifting for dynamic ranges is observed when the trough is deep and the mutation rate low.
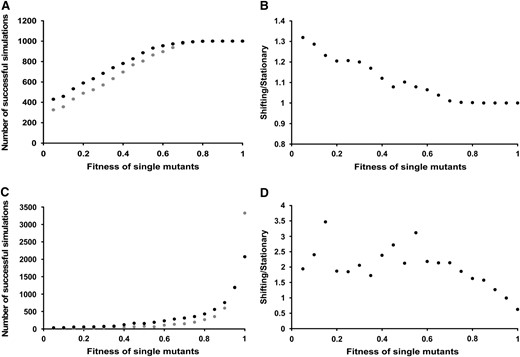
The number of successful simulations for mutation rates of 1 × 10⁻⁴ and 1 × 10⁻⁵. A and C show the number of successful simulations (see materialsandmethods) for stationary (shaded) and shifting populations (solid) with WAb/aB of 0.05–1.0 in increments of 0.05. B and D show the relative frequency of successful simulations. This is expressed as a ratio of shifting to stationary populations for the range of fitness values described above. A and B relate to a mutation rate of 1 × 10⁻⁴ and C and D to a rate of 1 × 10⁻⁵. Simulations were run 1000 times for A and 4000 times for C. Confidence intervals have been calculated for all data points on A and C but are not shown as in all cases they are rather small. In A, they range from ±8.67 to ±31.00, while in C they range between ±4.84 and ±15.50.
In the results described above we establish the proportion of simulations for which at least one double mutant is present at an arbitrary end point. In some cases double mutants will have been present at high abundance for many generations prior to the end point and in other simulations double mutants will have arisen, and through stochasticity, been lost rapidly from the population. Table 1 presents results illustrating how the expected time for a peak shift to occur depends upon mutation rate and whether the range is stationary or shifting. It is clear that as mutation rate decreases, the waiting time rapidly increases, but equally notable is that the relative difference between waiting times for stationary and shifting ranges increases with decreasing mutation rate. Indeed, with a mutation rate of 10−6 the waiting time in a shifting range is only 0.14 that found for a stationary range. Ideally, we would present results for lower mutation rates but computational time is prohibitive. It is worth highlighting that in a stationary range, the waiting time increases nearly 100-fold as the mutation rate is reduced by a factor of 10, which corresponds with the reduced probability of mutations occurring simultaneously at the two loci.
Waiting times for peak shifts depends upon mutation rate
Mutation Rate | |||
|---|---|---|---|
| 10−4 | 10−5 | 10−6 | |
| Shifting | |||
| Mean | 862.7 | 48,602.0 | 1,743,440.9 |
| C.I. | 186.9 | 12,635.6 | 390,569.2 |
| Stationary | |||
| Mean | 1,276.3 | 138,711.7 | 12,305,936.4 |
| C.I. | 357.0 | 35,224.2 | 4,955,752.2 |
| Shifting/stationary | 0.676 | 0.350 | 0.142 |
The average time for the first AB individual to appear in both stationary and range-shifting populations is shown for three mutation rates. We show means and confidence intervals for 50 simulations, except in the case of the stationary population with a mutation rate of 10−6 where, due to computing time restrictions, results are generated from the output of 15 simulations. Parameters used were K = 10, R = 1.8, d = 0.1, WAb/aB = 0.2, and WAB = 3.0.
The width of a species' geographic range will determine the overall importance of peak shifting due to mutation surfing in a period of range shifting (Figure 5). All other simulations that we show results for in this article have a range that is 50 columns wide. Here, results from simulations in which the range is systematically varied clearly illustrate that if a species has a narrow range (z = 10) then peak shifts are far more likely to occur during periods of range shifting: for the narrowest ranges nearly seven times as many simulations resulted in AB genotypes.
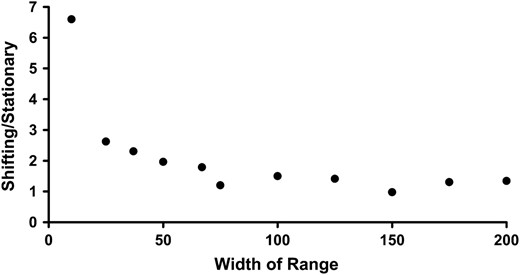
The relative frequency of successful simulations for different range widths. The relative frequency is expressed as the ratio of shifting to stationary populations. Parameters used were K = 10, R = 1.8, d = 0.1, WAb/aB = 0.2, and WAB = 3.0.
Simulations for a range of K and R indicate that, while K has a strong significant (P < 0.0001) effect on the number of successful simulations, R has no significant effect except for when K = 10, where there is a significantly higher probability of success at R = 1.2 than at any other value of R (K × R interaction, F12,39972 = 3.6, P < 0.001) (Table 2). Unsurprisingly, the proportion of simulations resulting in a fitness peak shift increases for both stationary and dynamic ranges with increasing values of K. The finding that peak shifts are more likely during a period of range shifting is extremely robust to the degree of dispersal incorporated. For example, with d = 0.05, we find that in a range-shifting population the mean waiting time for a peak shift to occur is 48,460 time steps, while it is 110,180 in a stationary population. When d = 0.50 the corresponding results are 36,972 and 99,427 time steps.
The influence of carrying capacity (K) and offspring production (R) on the frequency of peak shifting
R | ||||||||||
|---|---|---|---|---|---|---|---|---|---|---|
| 1.2 | 1.6 | 2.0 | 2.4 | 2.8 | ||||||
| K | Stationary | Shifting | Stationary | Shifting | Stationary | Shifting | Stationary | Shifting | Stationary | Shifting |
| 10 | 19 | 35 | 2 | 18 | 4 | 19 | 6 | 12 | 3 | 13 |
| 50 | 36 | 81 | 24 | 55 | 27 | 61 | 39 | 61 | 32 | 56 |
| 100 | 47 | 108 | 47 | 95 | 47 | 87 | 60 | 107 | 67 | 103 |
| 500 | 246 | 389 | 251 | 382 | 248 | 374 | 254 | 366 | 275 | 387 |
All values are the number of successful simulations out of 1000.
Even though double mutants have a strong selective advantage over other individuals, there is a substantial probability that recently arisen double mutants will suffer rapid extinction (Figure 6). The temporal pattern of double mutant extinction is similar in stationary and range-shifting populations, especially in the initial phases. However, whereas all the double mutants that survive for seven generations go on to survive until time = 100 in a stationary population, a small proportion of double mutants go extinct after a longer time period when the range is shifting. Surviving double mutants increase in population size rapidly, and the rate of increase is initially similar in stationary and range-shifting populations. However, whereas the abundance of double mutants in the stationary population continues to increase rapidly until the end of the simulations (at time = 100), the rate of growth slows in the shifting population (Figure 6).
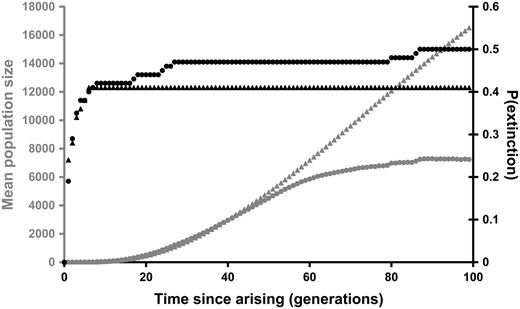
The fate of recently arisen double mutants. The probability of extinction (solid) and mean population size of surviving mutants (shaded) are shown for stationary (triangles) and shifting populations (circles). Here, time is set to zero as soon as the first double mutant occurs within a simulation. In each case data are collected from 100 simulations. Parameters used were K = 10, R = 1.8, d = 0.1, WAb/aB = 0.2, and WAB = 3.0.
DISCUSSION
Our simulations show that the characteristics of genetic variability can be substantially modified during a period of range expansion. Specifically, we show that the ability of mutations to surf on the edge of an expanding range front can lead to an increase in peak shifts within the fitness landscape. Deleterious mutations that arise on the edge of a shifting range can reach higher density and spatial extent than would be achieved in a stationary population. This is due to the mutation surfing phenomenon (Edmondset al. 2004; Klopfsteinet al. 2006; Bieket al. 2007; Traviset al. 2007) where lower-fitness genotypes, occurring by chance on the edge of the range, may colonize adjacent subpopulations and increase in abundance through a succession of founder effects. Lower-fitness individuals (aB/Ab) are usually outcompeted when the ancestral genotype (ab) has already reached fixation in subpopulations of a stationary range and away from the advancing front of dynamic ranges. The lower overall population densities at the edge of the moving range allow these suboptimal individuals to increase in abundance that, in the presence of sign epistasis, can lead to offspring with genotypes of higher fitness (AB) propagating through these demes and remaining at the expanding part of the range (Figure 3).
Our key result that fitness peak shifting is more likely during a period of range expansion is robust to the degree of emigration, the mutation rate, and the within-patch demographic parameters R and K. For both stationary and shifting populations we find a greater frequency of peak shifting when K is higher, reflecting the greater number of individuals in which mutations may occur. In general we find no effect of R, except for in the case of K = 10 and R = 1.2. Under these conditions the influence of genetic drift is greatest, which results in more frequent peak shifting. It is also robust to the width of the population's range although, as the range width decreases, the relative difference in peak shifting frequency between stationary and shifting populations increases. This is due to a greater proportion of a shifting population existing toward the expanding range margin, where the surfing dynamic leads to an elevated probability of double mutants arising. In this modeling exercise, we controlled the width of the range by removing all subpopulations that were more than the specified width away from the front. This actually results in smaller total population sizes for shifting ranges than obtained in stationary populations. For example, when the range width is 50, the mean number of individuals in a stationary population is 24,080 whereas it is 22,400 in a shifting population. For a much narrower range width of 10 there is a greater difference: the mean number of individuals is 4690 in a stationary population and 2990 in a shifting population. Were an algorithm used that removed a sufficient number of individuals at the rear edge of a moving range to control for population size, we would anticipate obtaining a marginally greater difference between the two scenarios, so our results are somewhat conservative. Our method of controlling range width leads to simulations that represent more accurately a population undergoing a range shift in response to environmental change, as opposed to an invasive range expansion where the occupied area will rapidly increase. Further work is clearly required to understand fully the importance of expanding range fronts to the genetic dynamics of invasive populations.
With very shallow fitness troughs and low mutation rates we find that peak shifts occur more frequently in a stationary range than they do in a moving range. Nearly neutral mutations will frequently drift to reasonable abundance in populations and provide a sizable background upon which a double mutant can arise. We hypothesize that in a moving range, some of these nearly neutral single mutants will arise and increase in frequency toward the rear margin, and in these cases they are likely to become extinct as the rate of range shifting is greater than their rate of spread. This additional loss of single mutants from the moving range could reduce the likelihood of a peak shift occurring. The same effect is not observed for the higher mutation rate because when the mutations are nearly neutral, all of the simulations result in peak shifts. The spatial dynamics of mutations arising toward the rear edge of a moving range is of clear relevance to the genetic dynamics of populations undergoing geographical shifts in their distributions due to environmental change, and is therefore an area requiring further attention. Future work addressing the genetic dynamics of both expanding and retreating range margins should also jointly consider the role of genetic diversity that is already present within the population while it is stationary, together with that which arises during range shifting due to novel mutations.
A substantial body of theory is devoted to understanding the role of epistatic interactions in shaping evolution (Wade and Goodnight 1998; Weinreich and Chao 2005; Weinreichet al. 2005; Jain and Krug 2007; Kim 2007). Sign epistasis represents a special case of between-locus interactions that leads readily to a complex fitness landscape. Recent work has indicated that the conditions required for peak shifting on these rugged landscapes may be less restricted than previously believed. In particular it is now clear that peak shifts occur more readily in spatially subdivided populations (Wade and Goodnight 1998). Our work extends previous consideration of spatial processes to range-shifting populations and highlights that nonequilibrium population dynamics can play an important role in shaping evolutionary trajectories. This has important implications as the rate of evolution may be accelerated during disease epidemics, the invasion of exotic organisms, or the shifting of species' ranges during episodes of climate change.
In our model fitness peak shifts occur infrequently, regardless of whether the population is stationary or moving. While our results clearly indicate that, across a broad range of parameter space, peak shifts are more likely during a period of range shifting, it is currently hard to judge how important the effects described will be for different organisms. For example, a key feature of a moving range that will determine the likelihood of peak shifting is the width of the expanding front. In our simulation we typically have just a few hundred individuals at the expanding front, and this may be orders of magnitude higher in many species, which would dramatically reduce the expected waiting time. Also, we simulate a simple two-locus model that leads to a very simple fitness landscape. In reality, fitness landscapes will be multidimensional (Whitlocket al. 1995) and at any one point in time there may be many possible routes for fitness to increase via a local valley. Assessing the plausibility and importance of the effects described in this article, for any organism, depends upon us also knowing the ruggedness of that organism's multidimensional fitness landscape and, in general, this is not currently well known empirically.
Previous work on the genetics of expanding ranges has focused on the spatio-temporal dynamics of a neutral mutation at a single locus (Ibrahimet al. 1996; Austerlitz and Garnier-Géré 2003; Edmondset al. 2004; Bialozytet al. 2006; Klopfsteinet al. 2006). The model presented in this article extends this work by exploring the genetics of ranges in two key directions. First, we have examined the dynamics of nonneutral mutations during range shifting and have incorporated genetic architecture in the form of sign epistasis. Second, rather than specifying a location where a single mutant arises and following its fate (Edmondset al. 2004; Klopfsteinet al. 2006; Traviset al. 2007), we have incorporated a mutation rate. An increased understanding of how genetic processes, such as epistasis, influence the course of evolution during periods of range shifting requires theoretical models that link the spatial population dynamics of range expansions with increasingly detailed representations of the underlying genetic processes. We have made several simplifying assumptions regarding the population dynamics and genetics of this system. Testing the robustness of results to a relaxation of these assumptions should be a priority for future work. The assumption of haploidy is appropriate for bacterial systems but there is a need to establish how well the results of these sign epistasis models hold for diploidy (Goodnight 2006). With a diploid genetic system the occurrence of a single individual, with the optimal genotype, is less likely to result in the ultimate fixation of that genotype unless the two loci involved are tightly linked. Recombination frequently leads to the optimal combination of alleles being broken up making it far less likely that the optimal genotype reaches high local abundance and then spreads throughout a higher number of demes. This effect is likely to make the frequency of peak shifting far more sensitive to dispersal propensity in a spatial diploid model than we found for our haploid model. A recent spatial diploid model (Peck and Welch 2004) demonstrated that the spread of an optimal genotype from a single deme, where it has already reached fixation, is enhanced when variations in environmental conditions lead to periods of regional extinctions followed by recolonizations. This suggests that the frequent founder effects during range expansions may facilitate the spatial spread of an optimal genotype, even for diploids, but further theory is required to verify this. Expanding range fronts will typically experience rapid increases in density following initial colonization. Therefore incorporating density dependence, within both the local population and the dispersal dynamics, would improve the realism of the model and ascertain how much ecological detail is required to comprehend the genetics of range-shifting populations. It has already been demonstrated that fitness-dependent dispersal can influence the probability of peak shifting in stationary ranges (Hadanyet al. 2004) and, therefore, its role in determining the evolutionary potential of range-expanding populations deserves attention.
Populations at the core of a range are typically characterized by larger carrying capacities, higher rates of local colonization, or lower rates of local extinction (Holt and Keitt 2000). These patterns may have important consequences for evolutionary trajectories on fitness landscapes as the relative roles of drift and selection will differ across the range (Alleaume-Benhariraet al. 2006). Therefore, predicting the genetics of range-shifting populations requires the incorporation of gradients in these key demographic parameters. Additionally, how species respond to current climate change will be strongly influenced by how well they are able to migrate across highly fragmented landscapes. Ecological models indicate that habitat loss and climate change interact to determine extinction risk at the species level (Travis 2003) but, currently, an understanding of the synergistic effects of these two environmental drivers on genetic processes is lacking. A recent empirical study, demonstrating mutation surfing in the rabies virus (Bieket al. 2007), has highlighted the importance of landscape structure effects on spatial genetic dynamics. Integrating population genetics and landscape ecology models would represent an important addition to recent developments in landscape genetics (Storferet al. 2007) and offer new insights into the biology of range expansions.
There is considerable current interest in the question of evolvability across several disciplines (Altenberg 1994; Wagner and Altenberg 1996; Earl and Deem 2004; Liebermanet al. 2005; Reader 2006; Sterelny 2006; Cilibertiet al. 2007; Kashtanet al. 2007) including evolutionary biology (Earl and Deem 2004; Liebermanet al. 2005; Cilibertiet al. 2007; Kashtanet al. 2007), cultural evolution (Liebermanet al. 2005; Reader 2006; Sterelny 2006; Acklandet al. 2007), and evolvable computing systems (Altenberg 1994; Wagner and Altenberg 1996). Our results highlight that the evolutionary potential of a system can depend upon its spatial dynamics and while we have been primarily interested in relating these findings to evolutionary biology they may also have implications for a broad range of other fields.
Footnotes
Communicating editor: L. Excoffier
Acknowledgement
We thank Steve Palmer and Tim Benton for statistical advice.
References
Ackland, G. J., M. Signitzer, K. Stratford and M. H. Cohen,
Altenberg, L.,
Beerenwinkel, N., L. Pachter, B. Sturmfels, S. F. Elena and R. E. Lenski,
Biek, R., J. C. Henderson, L. A. Waller, C. E. Rupprecht and L. A. Real,
Carter, A. J. R., J. Hermisson and T. F. Hansen,
Ciliberti, S., O. C. Martin and A. Wagener,
DeVisser, J. A. G. M., and R. F. Hoekstra,
Earl, D. J., and M. W. Deem,
Edmonds, C. A., A. S. Lillie and L. L. Cavalli-Sforza,
Eswaran, V.,
Hallatschek, O., and D.R. Nelson,
Hallatschek, O., P. Hersen, S. Ramanathan and D.R. Nelson,
Holt, R. D., and T. H. Keitt,
Ibrahim, K. M., R. A. Nichols and G. M. Hewitt,
Kashtan, N., E. Noor and U. Alon,
Lambrinos, J. G.,
Moore, F. B-G., and S. J. Tonsor,
Nelder, J. A., and R. W. M. Wedderburn,
Reader, S. M.,
Sanjúan, R., and S. F. Elena,
Travis, J. M. J.,
Travis, J. M. J., and C. Dytham,
Weinreich, D. M., R. A. Watson and L. Chao,
Whitlock, M. C., P. C. Phillips, F. B-G. Moore and S. J. Tonsor,
Wolf, J. B., M. J. Wade and E. D. Brodie,
