


Abstract
Short-oligonucleotide arrays typically contain multiple probes per gene. In genetical genomics applications a statistical model for the individual probe signals can help in separating “true” differential mRNA expression from “ghost” effects caused by polymorphisms, misdesigned probes, and batch effects. It can also help in detecting alternative splicing, start, or termination.
IN a genetical genomics experiment, a panel of 30 genetically different recombinant inbred mice was derived from a cross between parental strains C57BL/6 (B6) and DBA/2 (D2) (Jansen and Nap 2001; Bystrykh et al. 2005). These 30 mice were profiled with Affymetrix MG-U74Av2 arrays, using RNA isolated from hematopoietic stem cells and 12,422 probe sets. The observed array data were background corrected and quantile normalized (Bolstad et al. 2003; Gautier et al. 2004). Although various methods have been developed to compute a single expression value per probe set for further data analysis (e.g., Zhang et al. 2003; Wu and Irizarry 2004; Manly et al. 2005), we here develop an alternative statistical method to more fully exploit the information contained in the individual probe signals.
Differential expression for a given gene can result from trans-regulation by other genes or from cis-regulation due to variation in the region of the gene itself (altering functional motifs in the promoter region, changing the stability of the mRNA, or modifying the gene product in such a way that the feedback loop is shifted; Jansen and Nap 2004). In either case signal differences are supposed to be rather stable across probes (Figure 1A). The differences may, however, also change from one probe to another, due to known or unknown single-nucleotide polymorphisms (SNPs) or microdeletions between mRNA transcripts of different samples (Figure 1B; see also Doss et al. 2005), due to misdesigned probes (the majority of probe sets in Figure 1 are sequence verified; see also Mecham et al. 2004) or due to other known or unknown factors (e.g., alternative transcription). In such cases computing a single expression value per probe set, as in the current methods, leads to a loss of biologically relevant information. This will also hold for future alternative transcription/splicing arrays with probes located in different exons and not in the last exon or 3′-untranslated region only, as in the MG-U74Av2 array used in our experiment (Sharov et al. 2005). When the differences in signal between probes match with information in alternative splicing databases, they indicate that alternative transcription/splicing is the cause, and not an SNP.
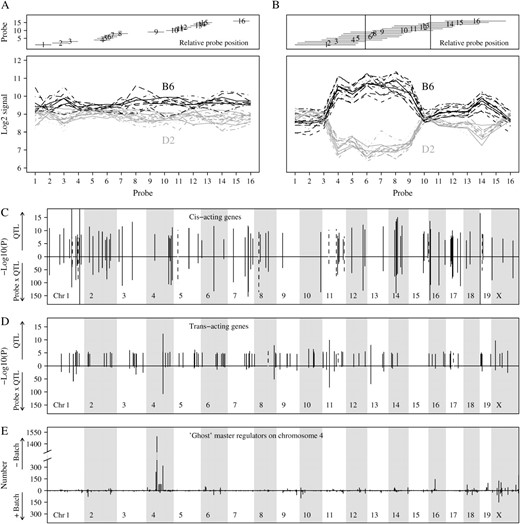
Model parameterization and fitting: two examples and whole-genome results. (A) Expression profiles of 30 mice, adjusted for the effects of probe, batch, and probe-specific batch effects, are shown for probe set 103036_at. The mice with solid (shaded) profile carry the B6 (D2) allele at marker D15Mit158. Expression difference is relatively constant across the 16 probes. (B) Similar plot for probe set 96243_f_at and marker D1Mit145. In this case the expression difference is highly variable between probes; i.e., there is probe-by-QTL interaction. We sequenced our D2 strain and found an influential polymorphism at relative base position 30 in probes 4–9 and a second polymorphism at position 57 in probes 11–15 (see vertical lines). The direction of the QTL effect is indeed such that the B6 allele has higher signal than the D2 allele. (C) Results of the QTL analyses on all probe sets. Significance of QTL (top) and of probe-by-QTL interaction (bottom) is shown for the 100 most significant cis-acting probe sets. The dotted lines indicate probe sets carrying a currently known SNP. (D) Similar plot for the 100 most significant trans-acting probe sets. (E) Results of the QTL analyses on all probe sets. At each genome position the number of probe sets is shown that significantly map to that position, on the basis of either a model ignoring possible batch effects (top) or a model including batch and probe-specific batch effects (bottom).
Genes colocalizing within 20 Mb of their QTL are termed here cis genes, and genes mapping elsewhere are termed trans genes. The cis genes show many more probe-specific QTL effects than the trans genes do (Figure 1, C and D). It is expected that probe sets carrying the more influential polymorphisms between probe and transcript will be picked up as cis-acting with probe-specific QTL effects. Indeed 10 cis-acting genes carry currently known SNPs in one or more of their probes and the directions of the probe-specific QTL effects are in agreement with the SNPs; i.e., the mouse allele perfectly matching the probes on the array has the higher signal (allowing us to use the array for genotyping as well; see also Jansen and Nap 2001; Rostoks et al. 2005). Further lab research (e.g., sequencing of the D2 strain) will make clear how many of the cis-acting genes are caused by SNPs, alternative transcription, or other (hidden) factors.
Our analysis separates probe sets that are “consistently” cis across probes from those that are more “probe-specific” cis and should be investigated in more detail in silico or in the lab. Figure 1C shows that P-values for probe-by-QTL interaction can be very extreme. At the one hand probe-specific QTL effects can be large relative to eij (and thus statistically significant), at the other hand they can still be small relative to the average QTL effect (and thus biologically not really relevant). The biologist can best inspect figures (Figure 1B and alike) to see how many probes underlie probe-by-QTL interaction and to decide which genes merit closer scrutiny in silico or in the lab.
Some genomic regions showed up as “master” regulators in trans of many genes, but only if the factor batch was excluded from the model (particularly chromosome 4, see Figure 1E). The 30 samples have been profiled in three batches and samples in the same batch generally showed a very similar profile across the 16 probes, whereas samples in different batches showed different profiles. Spurious linkage between batch and these genome regions leads to “ghost” regulators, and, since batch and probe-specific batch effects are likely to occur in experiments with multiple arrays, it underpins the need for careful statistical modeling. It is important to note that standard permutation tests in QTL analysis without batch effects will not protect against this batch artifact (permutation should be carried out within batch-probe combinations).
We have shown that current methods fail to consider various influential variations (technical, molecular, and sequence) in genetical genomics studies, with worse fit, loss of relevant information, and possibly wrong conclusions as a result. Our statistical analyses on the entire probe data set are therefore at the moment the methods of choice in genetical genomics applications with short-oligonucleotide arrays to help in separating “true” cis and trans genes from “ghost” ones. Data are available at www.genenetwork.org (Chesler et al. 2004).
Footnotes
Communicating editor: C. Haley
Acknowledgement
We thank J. P. Nap, D. J. de Koning, and C. S. Haley for stimulating discussions. R.A. was supported by Netherlands Organization for Scientific Research-Biomolecular Informatics grant 050-50-203.
References
Bolstad, B. M., R. A. Irizarry, M. Astrand and T. P. Speed,
Bystrykh, L., E. Weersing, B. Dontje, S. Sutton, M. T. Pletcher et al.,
Chesler, E. J., L. Lu, J. Wang, R. W. Williams and K. F. Manly,
Doss, S., E. E. Schadt, T. A. Drake and A. J. Lusis,
Gautier, L., L. Cope, B. M. Bolstad and R. A. Irizarry,
Jansen, R. C., and J. P. Nap,
Jansen, R. C., and J. P. Nap,
Manly, K. F., J. Wang and R. W. Williams,
Mecham, B. H., D. Z. Wetmore, Z. Szallasi, Y. Sadovsky, I. Kohane et al.,
Rostoks, N., J. O. Borevitz, P. E. Hedley, J. Russsell, S. Mudie et al.,
Sharov, A. A., D. B. Dudekula and M. S. Ko,
Wu, Z., and R. A. Irizarry,
Zhang, L., M. F. Miles and K. D. Aldape,
